Macro overview
Can the world’s most privileged issuer face liquidity stress? The U.S. Treasury is considered the most stable market in the world, anchoring global pricing and liquidity conditions. However, 2026 poses an unprecedented challenge for the U.S. Treasury Department. A sizable maturity wall of $9.6tn, accounting for almost one-third of total outstanding U.S. marketable debt, must be refinanced. Moreover, the Congressional Budget Office (CBO) projects the Federal Budget deficit to hit $1.9tn. This is equivalent to 5.8% of GDP, well above the historical average of 3.8% of GDP.
The main driver is the expansionary fiscal policy embedded in the 2025 Reconciliation Act, the so-called One Big Beautiful Bill Act, which we will refer to as “OBBBA”.
The OBBBA was signed into law on July 4, 2025, by President Donald Trump and it represents the major deficit catalyst of the current period. This act introduces broad tax cuts, lower marginal rates, work requirements, and higher defense outlays (alongside cuts in social programs like Medicare). Lower marginal rates and work requirements, according to CBO’s report, will reduce the unemployment rate by 0.4 percentage points. The combination of a sizeable increase in debt (projected to reach 126% of GDP by 2036) and the inflationary bias driven by lower unemployment commands higher yields. According to CBO’s estimates, the baseline impact of the OBBBA on the 10Y Treasury yield is a 14 basis-points increase, leading to a point estimate of 4.1%. That is why the increase in company investment by $1.1tn will be partially counterbalanced by a surge in yields, determining crowding out, reducing private investment by $440bn. So, despite determining an increase in the deficit by $4.7tn over the next ten years, the OBBBA is expected to stimulate real GDP growth by 2.2% in 2026.
The total $11.5tn financing need represents a funding shock even for the world’s most privileged issuer. However, an interesting phenomenon has emerged. Both Treasury issuances and Fed purchases have tilted toward short-term securities, partially offsetting the transmission of funding pressure into a duration shock for the private sector. The joint impact of the behaviours of the two institutions on the yield curve resulted in a stable, policy-driven front-end and mitigated the pass-through to the long end.
2026 funding mix: bills as shock absorbers
Since the second half of 2023, with the suspension of the debt limit, the Treasury Department has increased the share of T-bills in its issuances. As the rate hike cycle peaked in July 2023, the increased rollover risk was justified by the expectations of future rate cuts. Since then, the share of coupons (T-notes, T-bonds and TIPS) in new issues has remained stable. T-bills issuances have been used to achieve the target cash balance, absorbing rollovers and residual financing needs. This issuance policy ensures a stable and predictable supply of long-term securities, reducing uncertainty for investors.
Anchoring to recent policy and using the CBO recommended financing table, we modelled the evolution of U.S. marketable debt composition in 2026.
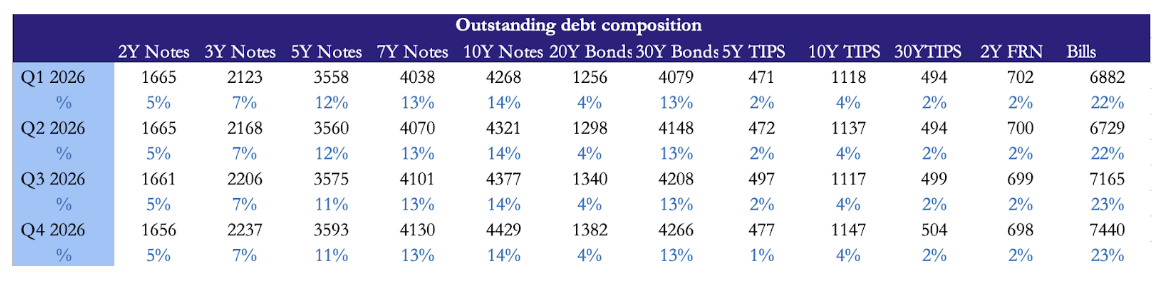
The baseline scenario for 2026 will test the limits of bill issuance. The historical target share for bills in total outstanding debt lies between 15 and 20%. The Treasury Department considers the latter a proper range to manage refinancing risk. In many stress scenarios the share of bills crosses 20%, reaching 35% after the Great Financial Crisis and 25% during Covid-19. It has stayed above 20% for the last 3 years, stimulated by a growing demand for safe-haven assets with interesting interest rates.

Further unaddressed risk lies in the medium-term evolution of U.S. debt. According to the CBO, the deficit may follow a growing trajectory for years, outpacing GDP growth and reaching 6.7% of estimated 2036 GDP. This would lead to a 120% leverage ratio for the United States by 2036. Since we showed that the bill share of debt outstanding is already stretched compared to its target, this financing need will likely result in remarkable coupon issuance. If these issuances outpace GDP growth, hence the domestic demand, the long end of the curve will likely suffer considerable market pressure. The U.S. will likely become increasingly dependent on foreign investors to finance its long-term debt.
The role of SOMA
Recent years have proved that an increasingly diversified investor base, comprising traditional and new players, is willing to absorb these issuances. The main buyer is the Federal Reserve, which operates in the secondary market through the System Open Market Account (SOMA).
As of December 2025, the Fed ended the Quantitative Tightening cycle. The current operating framework is focused on a different pivot mechanism of policy transmission: large-scale purchases of T-bills. Two programmes drive the purchases of bills:
- Reinvestment program: principal repayments from maturing agency MBS held on its balance sheet are reinvested in short-term securities
- Reserve Management program (RMP): a commitment to purchase short-term securities in order to relieve short-term rates from upward pressure as supply increases. The initial pace of $40bn per month will last for several months and eventually normalize.
The latter program has a double nature. Some might argue that it is a QE-like measure, as it actually expands the Fed’s balance sheet. However, the RMP declared goal is the front-end engineering. The Fed provides liquidity to the front-end and lubricates the money-market plumbing that allows for monetary policy transmission.
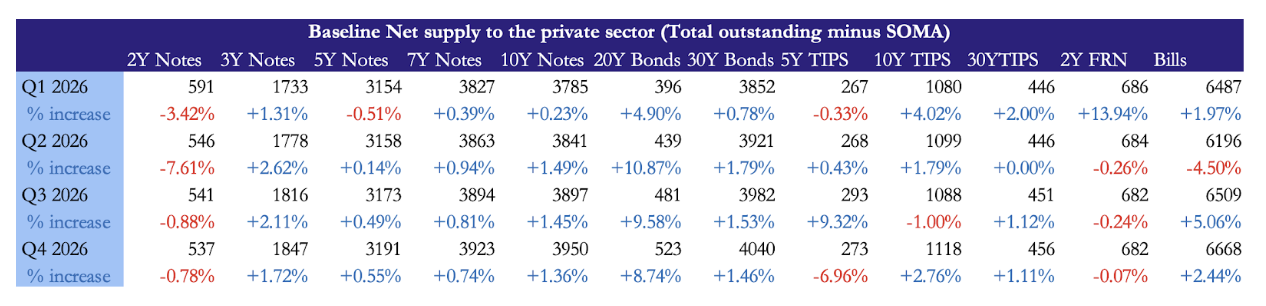
The impact of SOMA in the Treasury market led us to model the net supply of marketable debt available to the public as the free float after accounting for SOMA holdings. Treasury buybacks, aimed at improving market liquidity by purchasing off-the-run securities, have also been subtracted (based on current running caps) to compute the net supply. Compared to SOMA holdings, which still account for 14% of total outstanding debt after 3 years of QT, the latter program absorbs a negligible 1-2% of intermediate and long coupon supply.
The quarter-over-quarter increases are a signal of future supply pressure for each category and tenor. Analysing trends in demand allows for an equilibrium-based guidance for future curve movements.
 Demand anchors: MMFs, stablecoins, and foreigners
Private sector demand consists of a price-taking component and a price-sensitive one. The inelastic demand by the private sector serves to fulfil regulatory constraints and balance sheet targets, as well as hoarding high quality collateral for leveraged operations. Moreover, the USD status as the world’s reserve currency grants a core demand from foreign entities, with central banks and reserve managers driving price-taking foreign demand. The residual demand comes from price-sensitive foreign and domestic investors, including banks and money market funds (MMFs).
According to the TBAC’s February report on demand trends, MMFs purchases have been surging in the last two years, reaching a combined holding of 12% of the Treasury market. Foreign entities hold one third of the total marketable debt. Foreign official entities are mainly invested in T-notes, followed by short-term securities. However, diversification of FX reserves is slowly eroding this source of stable demand. On the other hand, foreign private investors’ demand has grown significantly over time, reaching almost $5tn. This demand is highly price-sensitive and is exposed to additional risk factors, such as rate differentials and exchange rate volatility. The TBAC’s report highlights the foreign private sector incidence in Treasury demand as one of the main fragilities, exposing it to potentially higher volatility in the long end.
There are other noteworthy trends in demand. Demographics are playing a major role. The 11% share of the Treasury market held by households is projected to grow stably as the bulk of domestic wealth shifts toward higher age cohorts, which are associated with higher fixed-income allocations. The aging population also pushes insurance companies and pension funds demand for treasury, through higher interest in annuity, such as defined benefit compensation plans.
The most interesting emerging players are stablecoin issuers. Stablecoins pegged to the USD, like Tether’s USDT and Circle’s USDC, have reached a noticeable size. The current market cap of nearly $280bn is backed by money market instruments such as T-bills and Treasury repos. As of Feb 2026, these issuers hold only 2% of outstanding bills. However, the TBAC highlights the dominance of these stablecoins as a potential transmission mechanism of foreign demand for digital assets to demand for Treasuries. The trade-off for the Treasury market is the pro-cyclicality of this channel. Risk-sentiment shifts of the highly volatile crypto market would spill over to the much more stable money market, requiring further monitoring in the future.
Implications for net supply of duration
Starting from the modelled net supply, we estimated the duration that must be absorbed by the private sector. Using reasonable proxies for the modified duration of each category and tenor, we found out that the front-end engineering by the Treasury and the Fed has sterilized the duration shock in terms of average sensitivity to interest rates. However, the budget deficit approved for 2026 requires a sizeable 6% increase in outstanding marketable debt. The baseline scenario sees the Fed absorbing slightly more than a quarter of this increase through its QE-like bills purchases, which will not be uniformly distributed throughout 2026, but rather follow a decelerating pace. This means that the dollar duration supplied to the private sector will increase throughout the year.

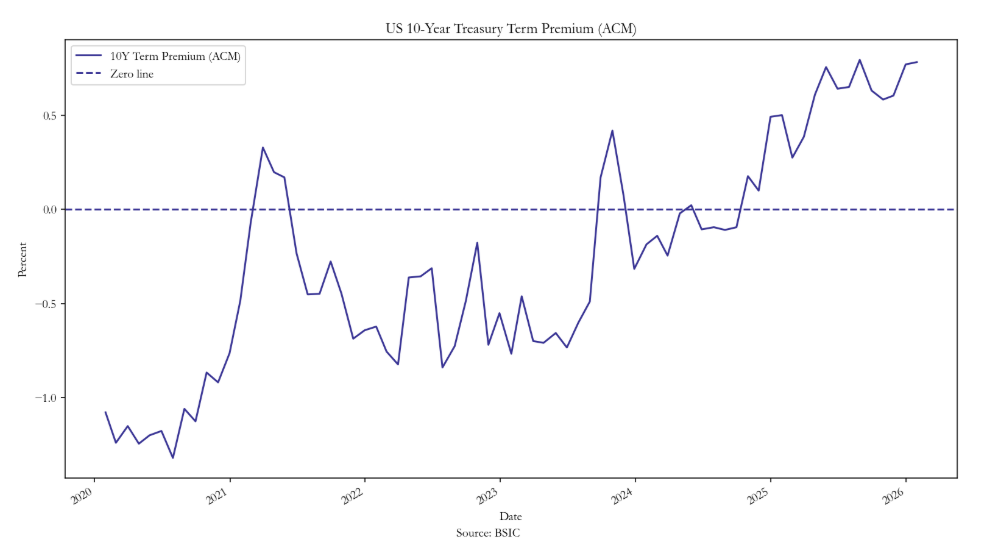
Every dollar of duration is a unit of interest rate risk that investors will have to bear. When the core demand for the long end cannot fully absorb this risk, its marginal cost is quantified by the term premium. This is the compensation required by marginal investors to hold a long-term security instead of rolling short-maturity instruments over time. In other words, it is a risk premium over the expected future path of short-term rates.
The Fed economists Adrian, Crump and Moench developed a statistical model to compute the implied term premium. The New York Fed publishes the ACM term premium on a monthly basis. Recent printings of the term premium reflect market expectations of a higher deficit trajectory. The progressive surge in the premium reflected repricing of fiscal risk, from the first Resolution instructions in February to the OBBBA approval in July. The term premium also incorporates uncertainty about future inflation and growth, which motivates the surge after last April’s Liberation Day.
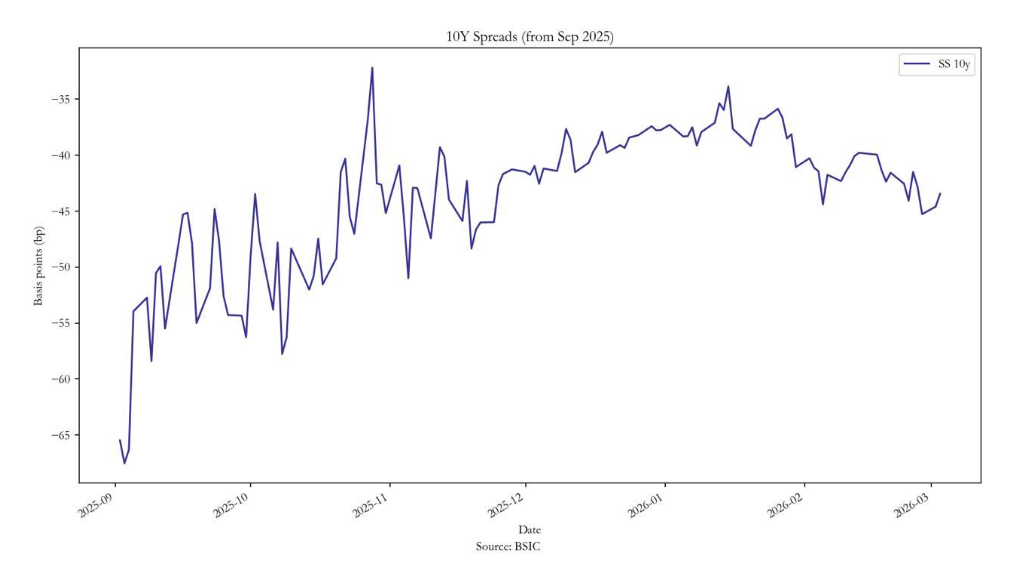
 As a complementary market-based cross-check, we monitored the 10Y Treasury–OIS spread as a proxy for balance-sheet absorption capacity. Following the CME convention, the spread is computed as the difference between the 10Y OIS swap rate and the 10Y Treasury yield. The relative cheapening of Treasuries versus swap rates in February is consistent with the view that the marginal cost of clearing duration risk is rising, as refinancing flows intensified in Q1 (concentrating $1.1tn of coupon issuances), cash Treasuries required greater concessions versus the OIS curve. However, this basis is not a pure measure of absorption capacity, as it is also influenced by hedging and positioning flows.
 Model risk
CBO’s budget projections provide point estimates for next year’s deficit with a historical average error of 1.1% of GDP. This implies a $400bn potential deviation from the $1.9tn baseline deficit. This is a pure estimate of baseline scenario accuracy, computed by excluding policy changes that occurred after the CBO completed its projections.
There are several policy changes that can affect CBO’s projections. Trade policy is one of the most closely watched. CBO’s budget projects tariff revenues earned in the second half of 2025 (that semester alone granted 3 times the historical yearly average of customs duties). In its baseline scenario, these duties will account for 1.3% of 2026 GDP, matching domestic corporate tax income. To better understand the relevance of this assumption, the authors remark that it translates to a $300bn increase above the level projected by the historical trend. This assumption decreases the deficit/GDP estimate by 1.1%. Although it is unlikely that under Trump’s presidency the tariff revenues will normalize, we might suggest that budget assumptions based on these numbers require further scrutiny. In terms of supply, the difference would be financed through bills issuance, leading to a 24% share of these securities in total outstanding debt. That is inconsistent with the historical target share of 15-20%, driving uncertainty about future Treasury Department issuance mix.
Yield curve positioning
Our net-supply model points to a curve regime where front-end rates remain policy-driven, while the long end increasingly clears the marginal duration burden. In a baseline monetary policy path of 2 rate cuts in 2026, the curve retains a steepening bias. In fact, the 10Y yield will face growing pressure from gradual pricing-in of the hiking debt trajectory. Furthermore, OBBBA lays the ground for further future inflation resurgence, creating a structural expectation of steepening. The CBO projects 10Y yields to slowly rise towards 4.4% in the next 10 years, while the policy-driven front-end will follow the monetary policy path.
However, our model is focused on a single driver of the curve slope and therefore abstracts from other forces that can dominate at shorter horizons. We treat “steepening bias” as a medium-term tendency under our baseline, not a deterministic path: near-term curve outcomes will reflect the interaction between the policy path, term-premium shocks, and the pace at which net duration is transferred to price-sensitive investors.
Conclusion
It is clear that the remarkable 2026 refinancing cycle we have just analyzed does not resemble a traditional solvency crisis. The U.S. maintains its exceptionalism, especially in monetary, reserve currency and capital markets terms. Therefore, it is not a matter of whether such an amount of debt can be financed, but rather how the associated duration risk gets distributed among balance sheets. The front-end engineering strategy of higher T-Bill issuance and Fed purchases has so far successfully prevented the funding shock from immediately converting into a duration shock, thereby curbing the term premium increase. However, this operation shifts refinancing risk to the near future. As the deficits persist and the bill composition exceeds historical equilibrium ranges, more medium and long-term issuance will probably become unavoidable in the next years, relying more and more on price-sensitive investors. If foreign demand growth won’t be able to compensate the increased supply pressure, the structural steepening trend will continue. The growth of USD-pegged stablecoins market cap will probably play a major role in channeling foreign demand.
T-Bills are not a new form of quantitative easing in the macroeconomic sense of the word, as they do not directly affect the compression of long-term yields. Rather, they act as a “liquidity valve,” in other words, buying time. In 2026, the Treasury market is no longer facing an issue of access, but one of absorption. Will the maturity wall remain a liquidity event, or will it trigger a structural repricing of USD duration risk?
References
[1] U.S. Department of the Treasury, “Monthly Statement of the Public Debt – January 2026”, 2026.
[2] Federal Reserve Bank of New York, “SOMA Holdings (End 2025)”, 2025.
[3] U.S. Department of the Treasury, “Sources and Uses Reconciliation Table – February 2026”, 2026.
[4] Treasury Borrowing Advisory Committee, “TBAC Recommended U.S. Treasury Financing Schedule for February 2026–April 2026 Quarter”, 2026.
[5] Congressional Budget Office, “The Budget and Economic Outlook: 2026 to 2036”, 2026.


0 Comments