Introduction
As we noted in our final publication of 2017, the year 2017 was characterized by very low volatility and stable positive returns on the majority of stock markets. This took place even despite the start of stimulus withdrawal by major central banks which was seen in the gradual increase in the target policy rates and consequent upward adjustment in the short-term interest rates.
The situation persisted in the first month of the new year. However, coincident with the swearing in of the new FED chairman Jerome Powell, the markets saw a significant fall in the value of indices like S&P 500 and Dow Jones as well as their European counterparts. The indices were down around 6-7 % on a two-day basis, and the Dow had the sharpest point decline since the years of the financial crisis.
However, any further improvement in economic indicators, which will be discussed below, put upward pressure on inflation expectations, leading to an upward revision of interest rates and bond yields. Indeed, Bridgewater Associates’ Ray Dalio pointed out, “recent spurts in stimulations, growth, and wage numbers signaled that the cycle is a bit ahead of where I thought it was. These reports understandably led to the reactions in bonds, which affected stocks as they did.”
Recent data are supportive for a higher inflation
Indeed, after the publication of our 2018 outlook a number of updates in the US have occurred. First, there has been an increase in the Fed’s target policy rate to 1.25% – 1.5% on the 13th of December. Secondly, the employment figures had a strong showing with the jobs gain of 160,000 in December and 200,000 in January, in addition to finally emerging wage growth: hourly earnings increased 2.9% in January YoY. Thirdly, Industrial production has been accelerating as the growth rates in the past four months reached above 3% YoY. Last but not least important, we started seeing indications of the output gap closure in the US economy in the 3rd quarter 2017, with the most recent observation for the 4th quarter resulting in a positive 0.5%.
The record low unemployment, consumer confidence at unusually high level and the recent tax cuts could provide a one-off boost to the disposable incomes, therefore the new term prospects for consumer spending remains positive.
Moreover, fiscal stimulus partly will affect the real economic activity and part of it will be translated into inflation. When this stimulus comes toward the end of a cycle, it tends to have a bigger impact in terms of inflation compared to when we are in the earlier cycle.
In addition, other important macro indicators are supporting higher inflation. The US new housing construction during the month of January increased by 9.7%, it is the highest level since October 2016. The other sign is an increase in imported prices during the month of January that was 1% MoM, and precisely 3.6% YoY, the largest advance since April 2017. This can increase the price of good and services that are connected to these imports, leading to an imported inflation effect.
Fed’s preferred measure of prices, the PCE inflation, has been on the rise as of recent data, while the CPI inflation has been steadily above 2% in the recent months. During the month of January CPI was 2.1% YoY and the Core CPI 1.8% YoY.

Chart 1: Personal Consumption Expenditures (Excl. Food and Energy), CPI for all Urban Consumers (Source: Federal Reserve Bank of St. Louis)
Fed maintained the rate at the last January meeting, but this is logical given that monetary policy takes 6-8 quarters to have an effect on the economy. Nevertheless, the markets have now begun assigning a higher probability to 4 rate hikes this year.
Looking at the Yield Curve
During 2017 the US Treasury Yield Curve has been flattening, mainly caused by the rise in short-term yields. Where spreads of long and short maturities continued to narrow to a decade low. However, now it has started to steepen.
Rising short-term yields in 2017 showed greater market confidence in the growth and inflation outlook, which also carries expectations the Federal Reserve will continue to normalize policy rates. Meanwhile longer yield largely reflected strong foreign buying and demand from institutions in order to hedge risks. What are we seeing now, in early 2018, is a situation where there is a continued strengthening of global economy and rise in inflation expectations, reflected in rising long-term yields.
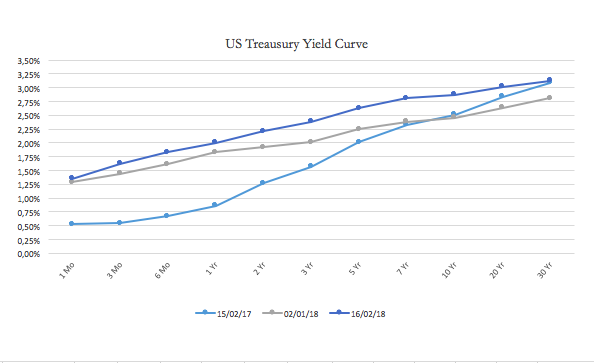
Chart 2: Comparison between US Treasury Yield Curves (Source: U.S. Department of the Treasury)
The Spread between the 2 and 10 Year Treasury bonds was 59bp in December and it has been decreasing for most of the year, compared to the 0.71bp spread that is today. This is indicative of a steepening yield curve. Historically the yield curve has been steepening after a recession. On the other hand, during a recession, the yield curve typically became inverted, where shorter term yield was higher than long-term ones. The current movement in the yield curve is indicating ongoing sustained global economic expansion.

Chart 3: 2- 10 Year Treasury Spread (Source: Federal Reserve Bank of St. Louis)
Markets
We are in the mature phase of the cycle, and the correction we have seen last week was expected, but a downturn in the market should not come soon. Some volatility will be certain, at least until next FOMC meeting, where the rate hike path will become clear.
The forward 12-month P/E is back to 17x. Before the correction, forward P/E reached 19.3x and the 10-year cyclically adjusted P/E (CAPE) was at 30x, the highest level since 1999. However, valuations are still high – forward P/E ratio is above the 5-year average (16x) and above the 10-year average (14.3x) – but more reasonable than before. Earnings data are coming strong: for the Q4 2017, by so far, 74% of the companies have reported positive EPS surprises and 79% sales above analyst expectations. The blended earnings growth for the S&P 500 is 14% in Q4 2017, which is higher than the 11% estimated rate of growth on December 31. Growth that has been seen in all sectors, led by energy. Being at this point of the cycle, a value trade is suggested. In particular, out of tech and healthcare sectors and give more weight to financials and eventually staples. However, if expansion comes in stronger than what we supposed, we may be too much early in the value trade.
The view on fixed incomes remains unchanged from the last outlook we tried to give in December. More bearish view can be added after the recent macro data and the budget announcement that will bring higher fiscal stimulus and also require additional funding via issue of T-bonds by the Treasury.


0 Comments