Introduction
Is the energy inflation in Europe transitory or structural? The plethora of factors that are affecting the energy market highlights the complexity of this question. The kind of inflation seen in energy is catching some Governments on their back foot, in need of rapid reactions. With many of them – namely Italy, Greece and the UK – already backing with financial aid national companies and households, this issue sparked a serious note on finding the real root of the problem, faster before the shadow of stagflation can take the centre stage in Europe.
In this article, touching upon our recent works on inflation, carbon trading and renewables energy – key topics unfolding in parallel – we will attempt to examine two of the greatest vulnerabilities of the particular market, namely, carbon permits and natural gas. This evaluation will allow us to answer the proposed question and shed some light on the growing energy crisis.
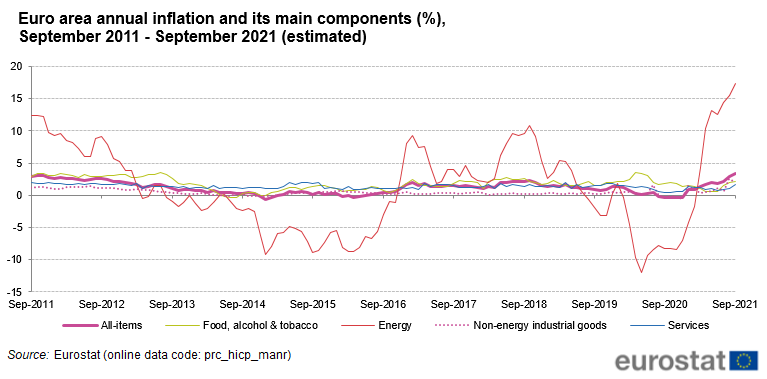
Source: Eurostat
The EU Agenda
On Carbon Trading
Since the aftermath of the Great Recession, the EU governing bodies have been acting boldly to reduce carbon emissions for big corporations. And as it has been extensively written in our last article, as recently as this year prices in this market have reached an all-time peak. This can turn sour the balance sheet conditions of some polluting firms forced to buy carbon permits and, for this reason, an investigation of the price drivers in the recent period should be conducted.
Source: carbonreporter.com
To explain the recent price surge there are, firstly, options in the derivatives market to consider. While the September contract expiring in the fourth week of the month, with the most open interest in calls around the €60 and €65 strikes, has let the price float around that range, we shift now to the December contract. Here, the call strikes with the highest open interest are all around €60 and above – all the way to €100, where there are 44m tonnes of open EUA positions. It is possible then that the sheer magnetic pull of all this open interest supports EUA prices through to the end of the year.
Back to the EU Agenda, this market looks pivotal not only for the green-compliant regulation, but also for the revenue-generating business that the EU Countries make by auctioning the carbon permits. It is no wonder that, back in September, the Spanish and Greek governments announced that they would be taking some of the additional revenue from their share of EUA auctions, and using it to support vulnerable consumers suffering the impact of soaring energy prices. To get a rough estimate of the potential benefit, the 27 EU member states have sold a total of 441m EUAs so far this year, generating a total revenue of €21bn.
On an opposite note, most EU countries have not handed out the free EU Allowance (EUAs) this year to their industrial installations yet, eight months after the normal deadline. In the former years, many industrials chose to sell these free EUAs for a one-off gain, and “borrow” the freely-allocated EUAs from the following year, to meet the first year’s compliance obligation. This is possible only because free EUAs are usually handed out in February and March, while the compliance deadline for the previous year is April. The lack of any allocation of free EUAs in the first half of the year tightened the market considerably and today, the carbon trading market faces a surplus of 1.6bn allowances already, much of which the same member States sold into the market.
On Renewables
Until well into the 20th century, global emissions were dominated by Europe and the United States. In 1900, more than 90% of emissions were produced in Europe or the US; even by 1950, they accounted for more than 85% of emissions each year. Yet today, Europe only accounts for 8.5% of global emissions, according to Our World in Data.

Source: Our World in Data
And despite the ongoing decarbonising effort, the EU is taking a further step to reach the ambitious target of a 55% reduction in carbon emissions compared to 1990 levels by 2030, and to become a climate-neutral continent by 2050. In this area, it has recently decided to implement a carbon tax at its borders, which implies a stronger demand on carbon credits and prevent “carbon leakage”.
While having WTO compatibility, the CBAM will equalise the price of carbon between domestic products and imports and ensure that the EU’s climate objectives are not undermined by production relocating to countries with less ambitious policies. In this framework, EU importers: “will buy carbon certificates corresponding to the carbon price that would have been paid, had the goods been produced under the EU’s carbon pricing rules. Conversely, once a non-EU producer can show that they have already paid a price for the carbon used in the production of the imported goods in a third country, the corresponding cost can be fully deducted for the EU importer.”
On a national level, countries are having a firm role too. Germany among others, with its ambitious Energiewende program, wants to reach at least 60% of renewables by 2050. For this instance, as recently as last year, the German market regulator Bundesnetzagentur (Bnetza) has awarded €317m to power utilities RWE, Steag, Uniper and Vattenfall in the country’s first tender for the closure of coal power plants.
And while the country may be set to reach the pot at the end of the rainbow, some short-term challenges related to renewables are hindering and worsening the current energy situation. While the country has increased its solar capacity by nearly 650% between 2008 and 2010, the on-off nature of solar energy throughout the season persists. For example, Germany produced about 10 times more solar energy in the month of June 2018 than it did in December 2018. At times during the summer, Germany’s solar and wind plants generate so much electricity that the country cannot use it all, transmitting some of the excess to neighboring Poland and the Czech Republic.
For this reason, the increased seasonality of this phenomenon has had neighbouring countries’ authorities complaining that a renewables-reliant economy may strain their own power grids can cause unpredictable swings in the cost of electricity.
But what about Natural Gas?
Despite all the previous excitement around EUA prices topping €60 for the first time and moving steadily up to monthly peaks, we still need to face the fact that coal-fired power generation, as of now, is still actually more profitable in the near term than natural gas. While institutional and media attention has turned sour on the carbon trading mechanism that helped futures prices rise so much, it should be noticed that similar sources of energy have appreciated as fast, if not faster, than the rise of EUAs.
Below we can find some useful information that compares the recent price surge in the natural gas area and, most importantly, depicted are the Clean Dark Spread and the Clean Spark Spreads. Clean Dark Spreads are a reflection of the cost of generating power from coal after taking into account fuel (coal) and carbon allowance costs. A positive spread effectively means that it is profitable to generate electricity with a profit for the period in question, while a negative spread means that generation would be a loss-making activity. On a same note, CSS is the difference between the wholesale market price of electricity and its cost of production using natural gas.
It can be argued, as it will be done below, that the current gas market shows tight supply and high prices, in dire need to rebuild the storages before the winter. The electricity prices – with an almost 1-to-1 correspondence with natural gas – have been driven vertically up in the recent months both due to several factors, ranging from geopolitics to structural impediments of natural gas itself and its transportation.
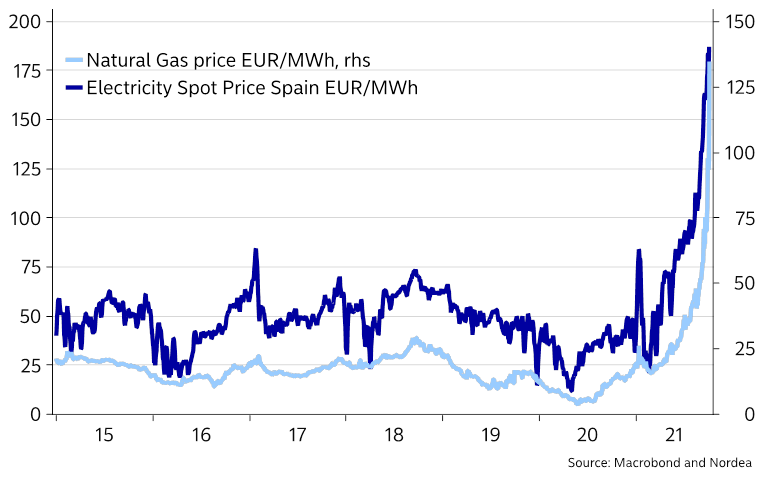
Source: Nordea
Demand
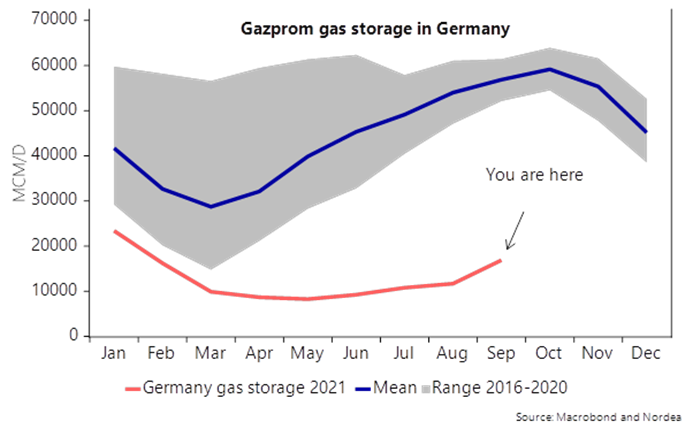
NW European gas inventories, currently around 25% below average, have had a steady fall since the start of the year due to particularly cold weather in April and in May. This led to unexpected demand for residential heating. In combination with heatwaves in the summer and remote work from home, the effect was especially amplified. As a result, in Q1 2021, European gas demand was up 7.6% and storaged gas further from the 10y average. Now, just as we are entering Q4, the market is also pricing in a winter risk premium, which is reflected in the current prices.
As a result, Goldman Sachs estimates that TTF can balance the market at $17.60/mmBtu (Metric Million British Thermal Unit) in average winter weather, incentivizing maximum gas-to-coal (G2C) substitution to normalize the end-winter season storage.
On the industrial side, the anticipation of economic recovery that came to be after the introduction of vaccination programs led to an output rebound. Along with carbon price rises, many companies transitioned from coal to gas to reduce costs. European demand definitely contributed to the tightening of gas balances, throughout the year, which are shown below:
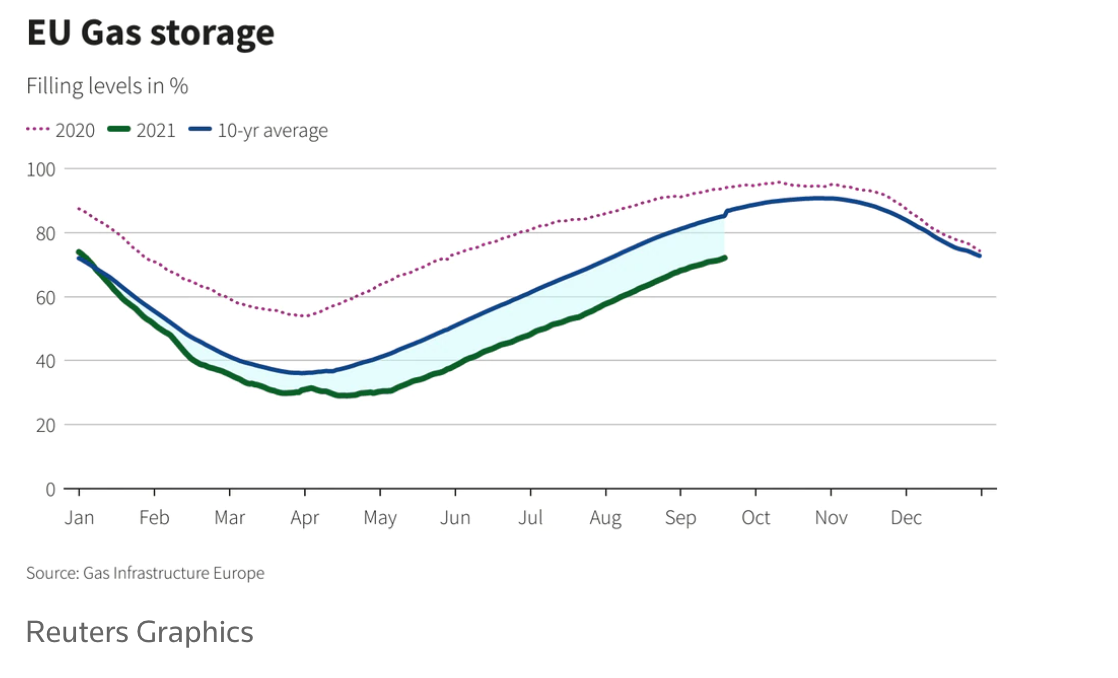
Source: Gas Infrastructure Europe
Supply Factors
Natural Gas Supply from Russia
The energy crisis has highlighted Europe’s dependency on Russia, which will continue to increase with the introduction of Nord Stream 2 pipeline. Some of the reasons why supply has fallen includes an increased, above average, domestic demand but also output problems.
One unexpected event was the gas plant fire at a Russian condensate processing facility at Urengoy in August. This led to a drop in gas flows to NW Europe, peaking at about 60 mcm/d (2 Bcf/d) in mid-August, a sharp fall from its typical rate of 81 mcm per day. For a whole month, until September 15 when it was normalized again, supply was limited.
Many analysts believe that Russia has weaponized its leverage on gas supply by limiting it all year for geopolitical purposes. Specifically, according to Naftogaz’s Vitrenko, Gazprom has been purposely restricting gas supplies to Europe, preventing other Russian enterprises from accessing Ukraine’s gas transmission system, and preventing shipments from Asia from reaching Ukraine through Russia. The deliveries of natural gas may have also been blocked as a way for Russia to push for the launch of Nord Stream 2.
It is important to mention at this point that, however, Russia’s Gazprom has already completed the Nord Stream 2 pipeline, which will be used for gas flows under the Baltic Sea to Germany. What remains to happen before the pipeline becomes operational is for Germany’s energy regulator to approve the completion of the project and for tests to finalize.
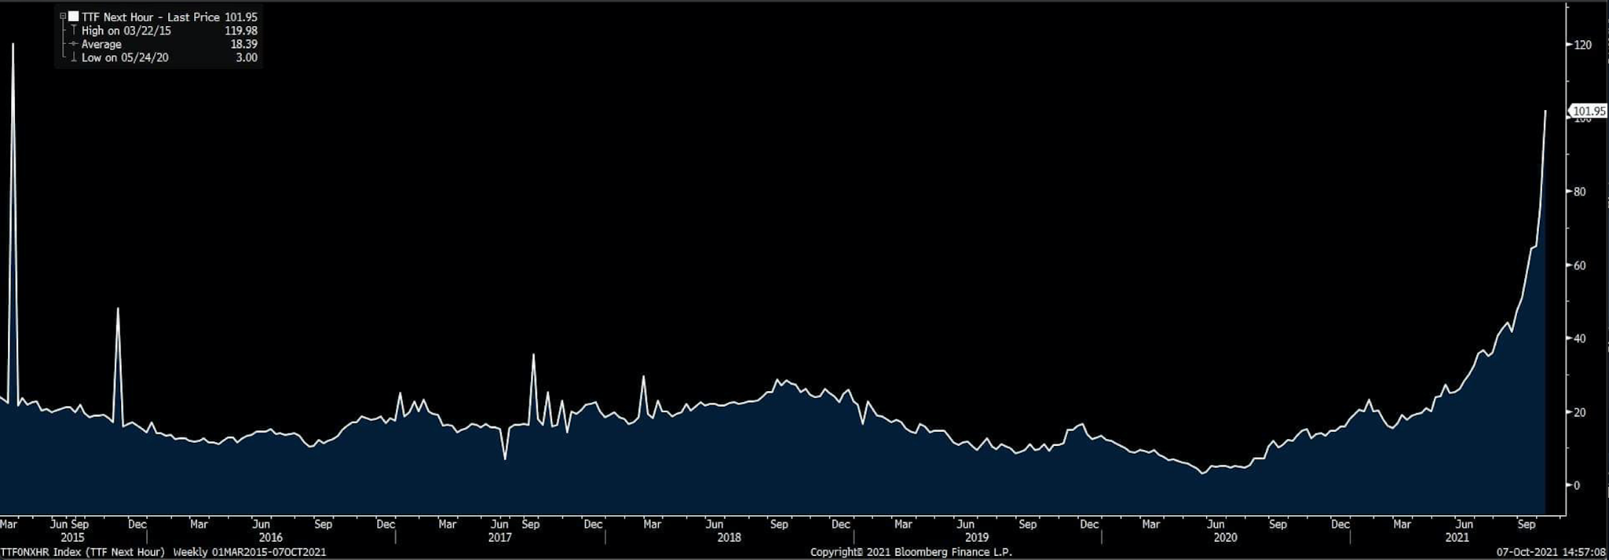
Source: Bloomberg TTF Next Hour-Last Price
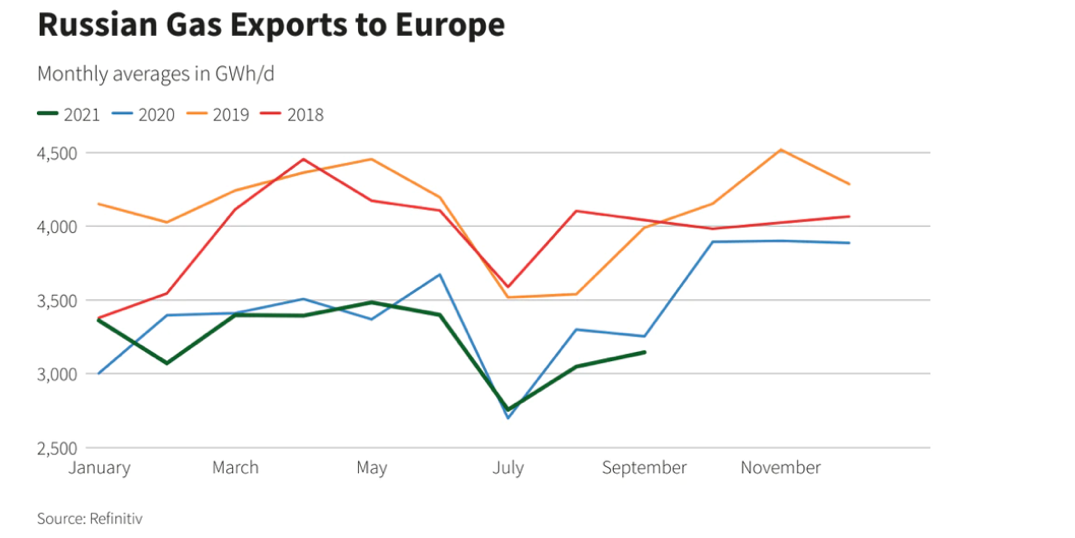
Source: Refinitiv
Imported Liquified Natural Gas (LNG)
Due to the aforementioned reasons, European gas reserves are extremely depleted both by limited supply and increased demand: what was consumed during the colder months of Q1 could not be replaced over the summer. For this reason, the European market turned its attention towards LNG imports as a way to replenish its natural gas reserves.
This alternative, however, is not much of a solution, since the LNG category has also been undersupplied throughout the year.
Source: Nordea
As if that were not enough, Europe is forced to compete with Asia, a continent which is also heavily dependent on NLG, driving prices to unprecedented levels. High liquefied natural gas (LNG) prices are linked to Asia’s economic recovery. Specifically, as seen in the graph below LNG prices hit a high of $34 per million British thermal units this week compared with just under $2 mmBtu in May of last year. In regards to LNG supply issues, heavy maintenance in Australia and Russia are to blame, disallowing Europe from importing as much gas as needed.
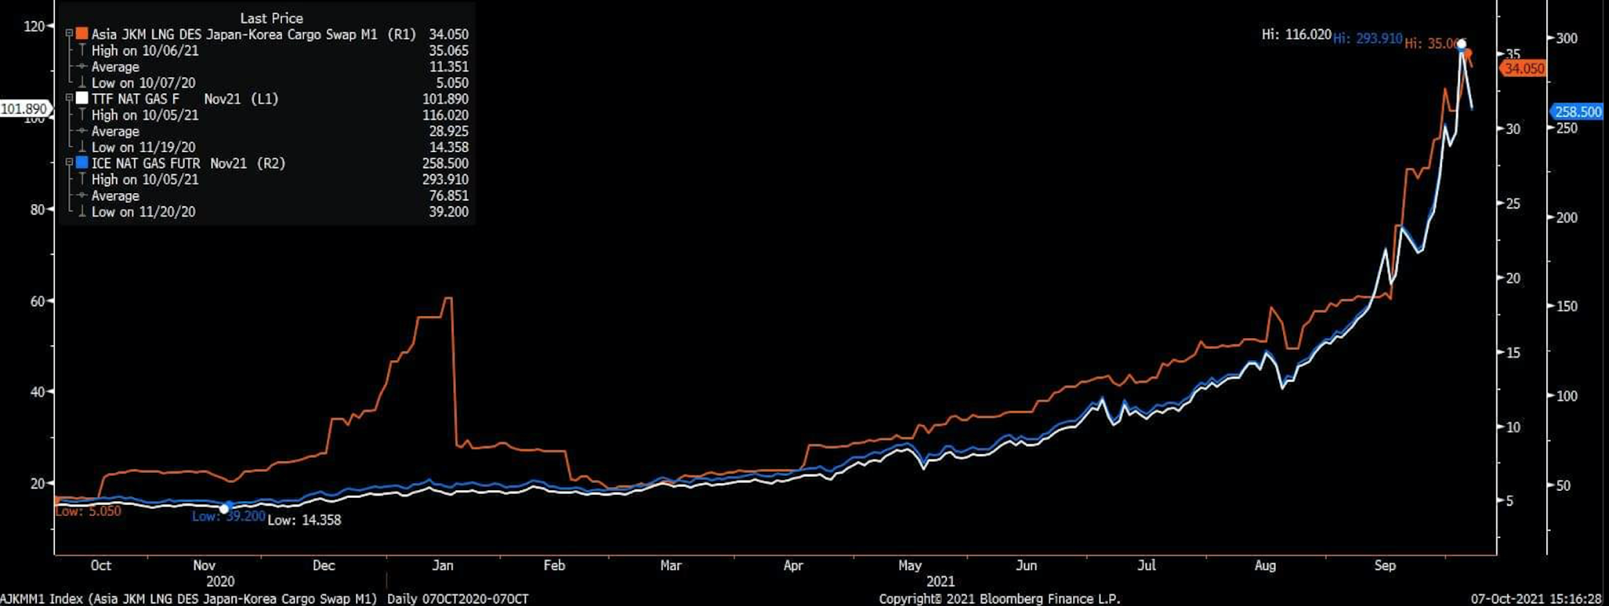
Source: Bloomberg, Asia JKM LNG DES Japan Korea Cargo Swap M1 (R1)-TTF NAT GAS F NOV21 (L1)-ICE NAT GAT FUTR NOV21 (R2)
On the renewables note, oil companies would theoretically need to make up for under investment in 2020 but they are doing the exact opposite. They are cutting back on spending, letting oil wells deplete, as ESG standards have become a key matter investors and worsened regulatory pressure. Investors and governments demand that these companies invest in renewable energy, reducing the amount of money they will spend in oil exploration. This is done in the hope that, overtime, dependency on renewables will increase, restricting the availability of fossil fuels as possible solutions.
Arguably, an even more challenging situation comes up with coal. As countries decrease coal production in favor of renewable energy, they end up needing a lot more natural gas. This is because natural gas power plants can be quickly turned online when the wind is not blowing or the sun is not shining. Hence, it is the only flexible solution to energy production uncertainty from renewables.
The UK, for example, has invested billions for offshore wind farms in the North Sea. These farms account for 20% of the country’s electricity. But in 2021 due to decreased wind speed down to 7%, utility companies used natural gas to fill in the gap causing prices to surge. The shift towards renewable energy has made the world more dependent on natural gas, which will grow further as countries and companies shift away from coal.
Trade Idea
With the situation worsening and escalating at a rapid pace, especially under a colder than average winter, it looks like European and Asian consumers will be the most vulnerable. For this reason, we suggest to hedge the current risk through OTM TTF calls (such as CAL23 TTF) or a more technically complex, but potentially lower downside risk, protective collar that could lower the premium paid.
Moreover, on a macro note it would make sense to be long USD/CNY and USD/EUR until year-end, expecting the US economy – given the bigger reliance on shale oil –to be less scared of the energy crunch turning into an immediate negative growth story than the ECB and the PBoC should.
Last but not least, a further financial instrument has risen to the ranks of the liking for both institutional investors and retails alike, willing to join the carbon futures upward rise. This new “Carbon ETF”, – KraneShares Global Carbon ETF [NYSE Arca: KRBN] – one of the only two available of the kind, is 75% invested in EU carbon futures, then the California Carbon Allowances and then RGGI (northeastern US) carbon allowances, willing to to exceed the returns achieved by the IHS Markit Global Carbon Index.
Having a 0.79% expense ratio, towards the low end for actively managed funds and small in relation to the potential upside, it should be noted however that a possible contango in the futures market means that the performance of a futures-backed ETF will never exactly match the performance of the underlying asset, because of roll cost/yield dynamics. And these roll costs can be substantial: a 1% monthly cost comes to a nearly 13% cost on an annualized basis, that could wipe out any gains in the spot price, or similarly, exacerbate any losses in the spot price.
Conclusion
All in all, it is becoming ever more clear that the global energy market has become extremely polyparametric. Ranging from COVID-19 and supply chain complications to climate change and geopolitics, the current energy crisis appears to have both short and long term implications. The penalization of fossil fuel use through carbon permits and the renewable energy agenda have grown further complexity into the issue, meaning that that the only way out is a globally coordinated action.


0 Comments