An overview of inflation interpretations
In the following article, we are going to examine the current framework of monetary policy – inflation targeting – with a focus on the evolution of the inflation process Post-Bretton Woods and its effects on the current regime of price stability.
In the post-war era, the behavior of inflation has been explained with different approaches.
At first, a major role was attributed to labor markets and the change in relative bargaining power. The first Philips curve equation was discovered in 1958 by Philips in the UK: it connected the price determination process to inflation, establishing a relationship between unemployment, the expected inflation rate and the actual inflation rate.
Then, during the Great Inflation of the ‘70s, the focus shifted on the role played by monetary aggregates and the changes in the money supply. Friedman, in 1970, famously claimed: “Inflation is always and everywhere a monetary phenomenon in the sense that it is and can be produced only by a more rapid increase in the quantity of money than in output”. According to this theory, the level of aggregate prices would result from basic laws of demand and supply. The demand side would be determined by the money available per unit of time: this depends on the quantity of money (as defined by FED’s monetary aggregates) and the propensity of its holders to spend it, measured by the so-called velocity – the volume of purchases relative to the supply of money (the reverse of the liquidity preference introduced by Lord Keynes). Instead, the supply side would consist of all real values available for purchase.
Nowadays, the most common approach to interpreting inflation is the so-called NAIRU (Non-Accelerating Inflation Rate of Unemployment): this model – generally through forward-looking Philips curves – postulates the existence of a neutral real interest rate (r*) which keeps output at potential and the economy at full employment maintaining price stability – generally determined by a 2% inflation target.
The central banks, therefore, adjust the short-term nominal interest rates and influence – with market participants’ – long-term rates, to ensure that market rates approach r*, the neutral real interest rate, which is traditionally determined exclusively by real factors. The monetary policy, therefore, is assumed to be neutral in the long run – in steady-state conditions – exerting only a transitory influence.
The correlation of real factors with real rates
The general framework will assume that the supply of savings and demand for investment will meet in the long run at a level defined by r*. It is generally recognized that main real factors which influence savings and investments are:
Marginal product of capital: labor productivity (the ratio of GDP to hours worked) divided by capital intensity (the ratio of the total capital stock to total hours worked) times a constant capital share. It affects positively the neutral real interest rate.
Output growth: annual real GDP growth. It affects positively the neutral real interest rate.
Productivity growth: annual total factor productivity (TFP) growth. It affects positively the neutral real interest rate.
Dependency ratio: size of the dependent population (aged 65 or above and 19 or under), divided by the size of the working-age population. It affects positively the neutral real interest rate.
Life expectancy: life expectancy at birth. It affects negatively the neutral real interest rate.
Population growth: annual population growth.
Relative price of capital: the capital price index divided by the consumption price index, and since 1929, the gross private domestic investment deflator divided by the personal consumption expenditures deflator. It affects positively the neutral real interest rate.
Inequality: income share of the top 1% of the population. It affects negatively the neutral real interest rate.
Risk premium: higher moments of annual GDP growth and inflation, as measures of fundamental risks, US equity risk premium. It affects negatively the neutral real interest rate.
Looking at the historical data of a 2017 BIS report on real interest rates depicted in the following chart, we can notice that in the latest period, starting in the 1980, most of these standard factors are correlated with the decline in real interest rates, while, if we extend the sample to cover preceding periods, mostly all the correlations between these factors and real interest rates disappear.
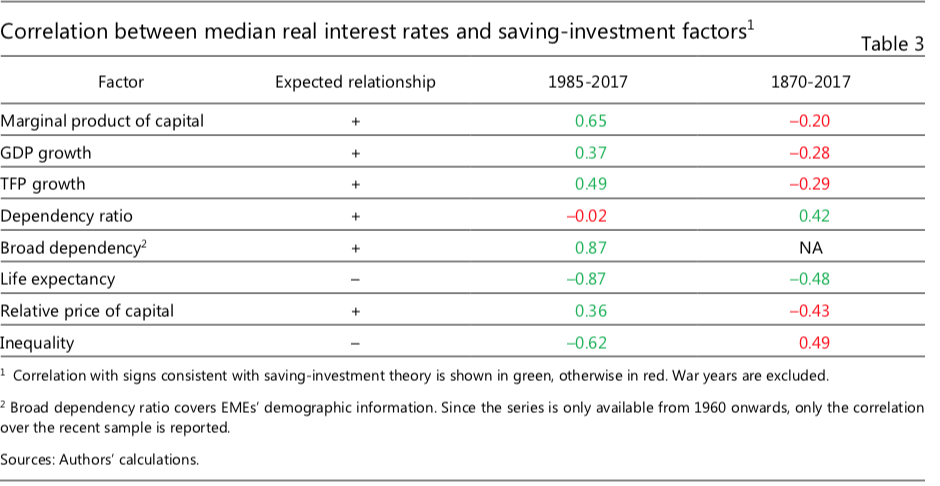
Source: BIS
The aforementioned report offers also an analysis of the correlation in various historical subsamples. It appears that, apart from the last 30-year period (post-Volcker), these real factors are not correctly associated with the real interest rates and there is clear parameter instability in all the variables.
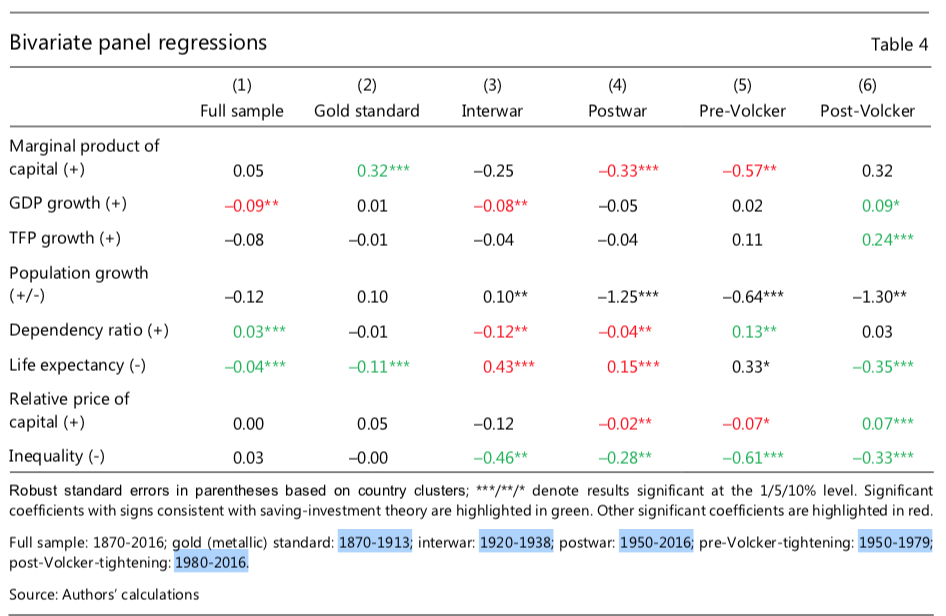
Source: BIS
This leads us to the conclusion that no single real factor or combination of such factors can consistently explain the long-term evolution of real interest rates.
The evolution of the inflation process
The inflation-targeting approach employed by central banks uses the nominal interest rate to target the neutral real interest rate r* whose level is estimated through the real factors aforementioned. The effectiveness of this approach is inherently reliant on the link between measures of economic slack and inflation as described by the Philips curve. However, in the Post-Bretton Woods era, this connection has been weakening over time. For example, according tothe slope of Philips curves for wage and price inflation (in G7 countries) is converging towards 0
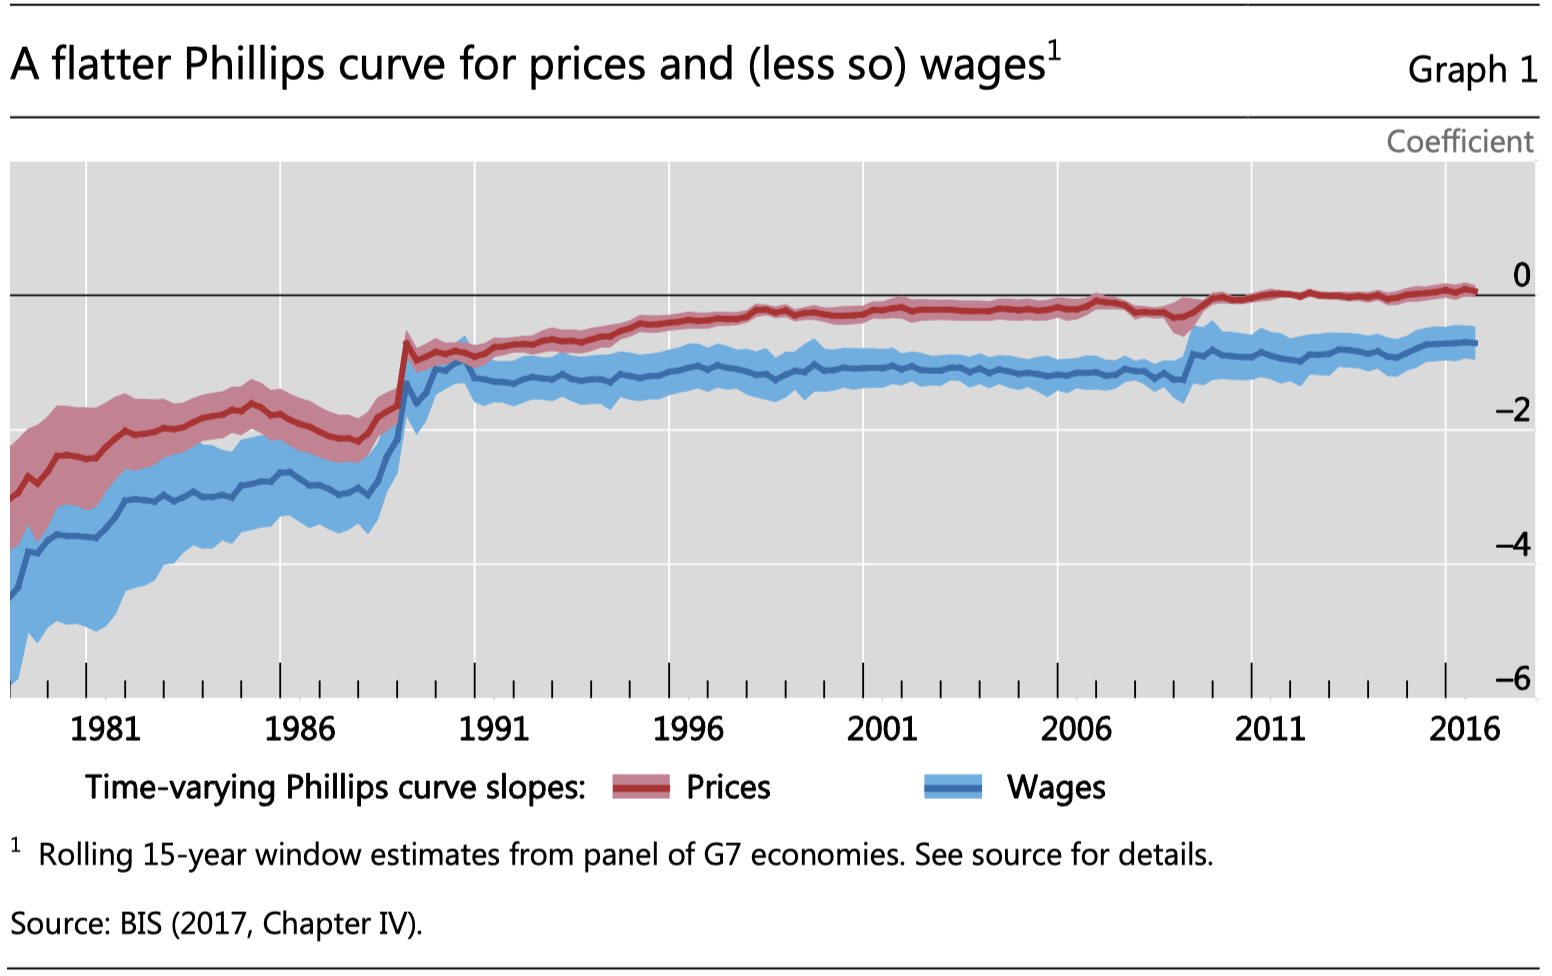
Source: BIS
A possible reason is that this period has been characterized by globalization and relevant demographic changes. In particular, the globalization of labor markets led to structural changes in the world economy. The emergence of China, the fall of the Iron Curtail, and the opening of India after the IMF bailout of 1991 greatly expanded the global labor force. The result has been the addition of 1bn+ workers and a shrinkage in the share of advanced economies labor force. For this reason, the renewed globalization of goods has been characterized by the delocalization of manufacturing activities, especially those reliant on a cheap labor force, in developing economies. Likely, this led to falling wages in advanced economies and thus, strong downward pressure on inflation. Data point in this direction: the 2016 Deutsche Bank Asset Returns study showed cumulative real income growth by the percentile of global income. Developing economies (A) and small elites in advanced economies (C) have experienced huge gains, while middle and lower classes of advanced economies had no growth at all (B).
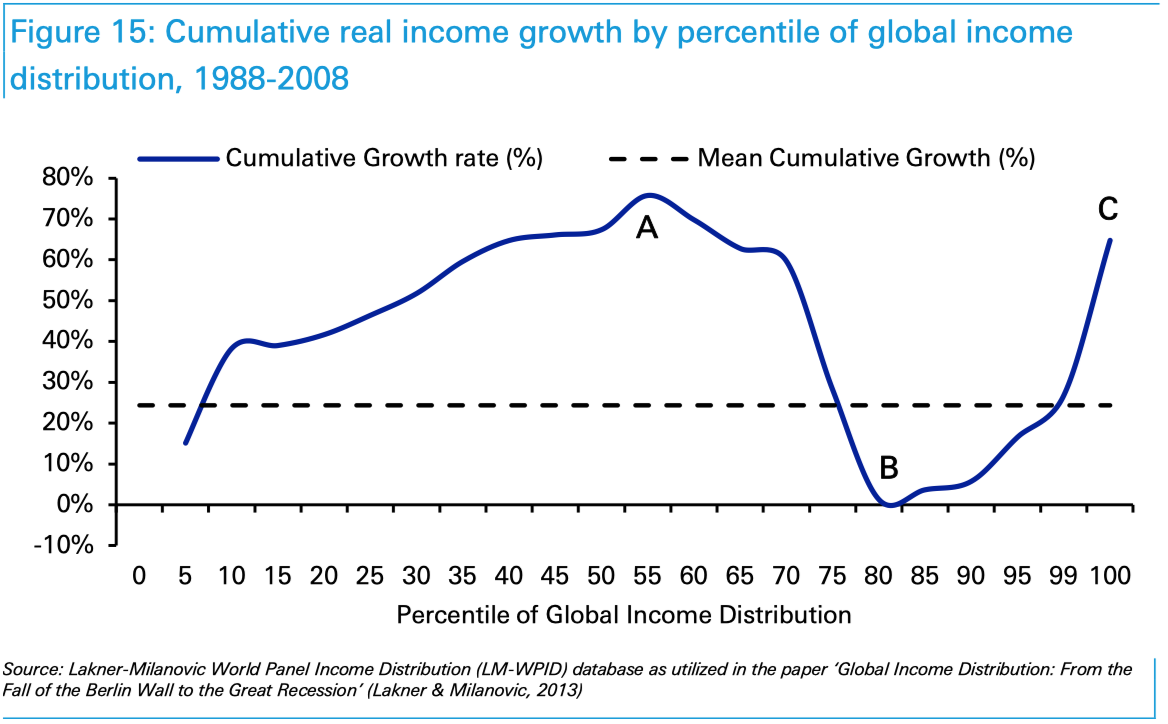
Source: Lakner-Milanovic World Panel Income Distribution
Moreover, globally integrated supply chains may have permanently altered the traditional process of wage-price inflation described by the Philips curve and typical of the Bretton-Woods era. The growth rate in intermediate goods trade – a reasonable indicator for growth in global value chains – has been increasing in recent years: increasing integration in production processes worldwide may explain why the influence of domestic measures of economic slack on inflation has been decreasing.

Sources: Johnson and Noguera (2016); Powell (2016)
This evolution in the inflation process should imply an increasing correlation between global measures of economic slack and domestic inflation. A study conducted by Auer and others at BIS in 2017 points in this direction. They focus on ITO – intermediate trade openness – defined as the ratio of intermediate imports and exports to GDP; this should be a better proxy to measure integration in GVCs than conventional measures including final imports and exports. Data shows that growth in ITO is positively correlated with growth in RGF – relative global factor – defined as the difference between two coefficients which measure the impact of global measures of economic slack and domestic ones on inflation. The result is that while the domestic version of the Philips curve is no longer reliable, global ones may increasingly be so.
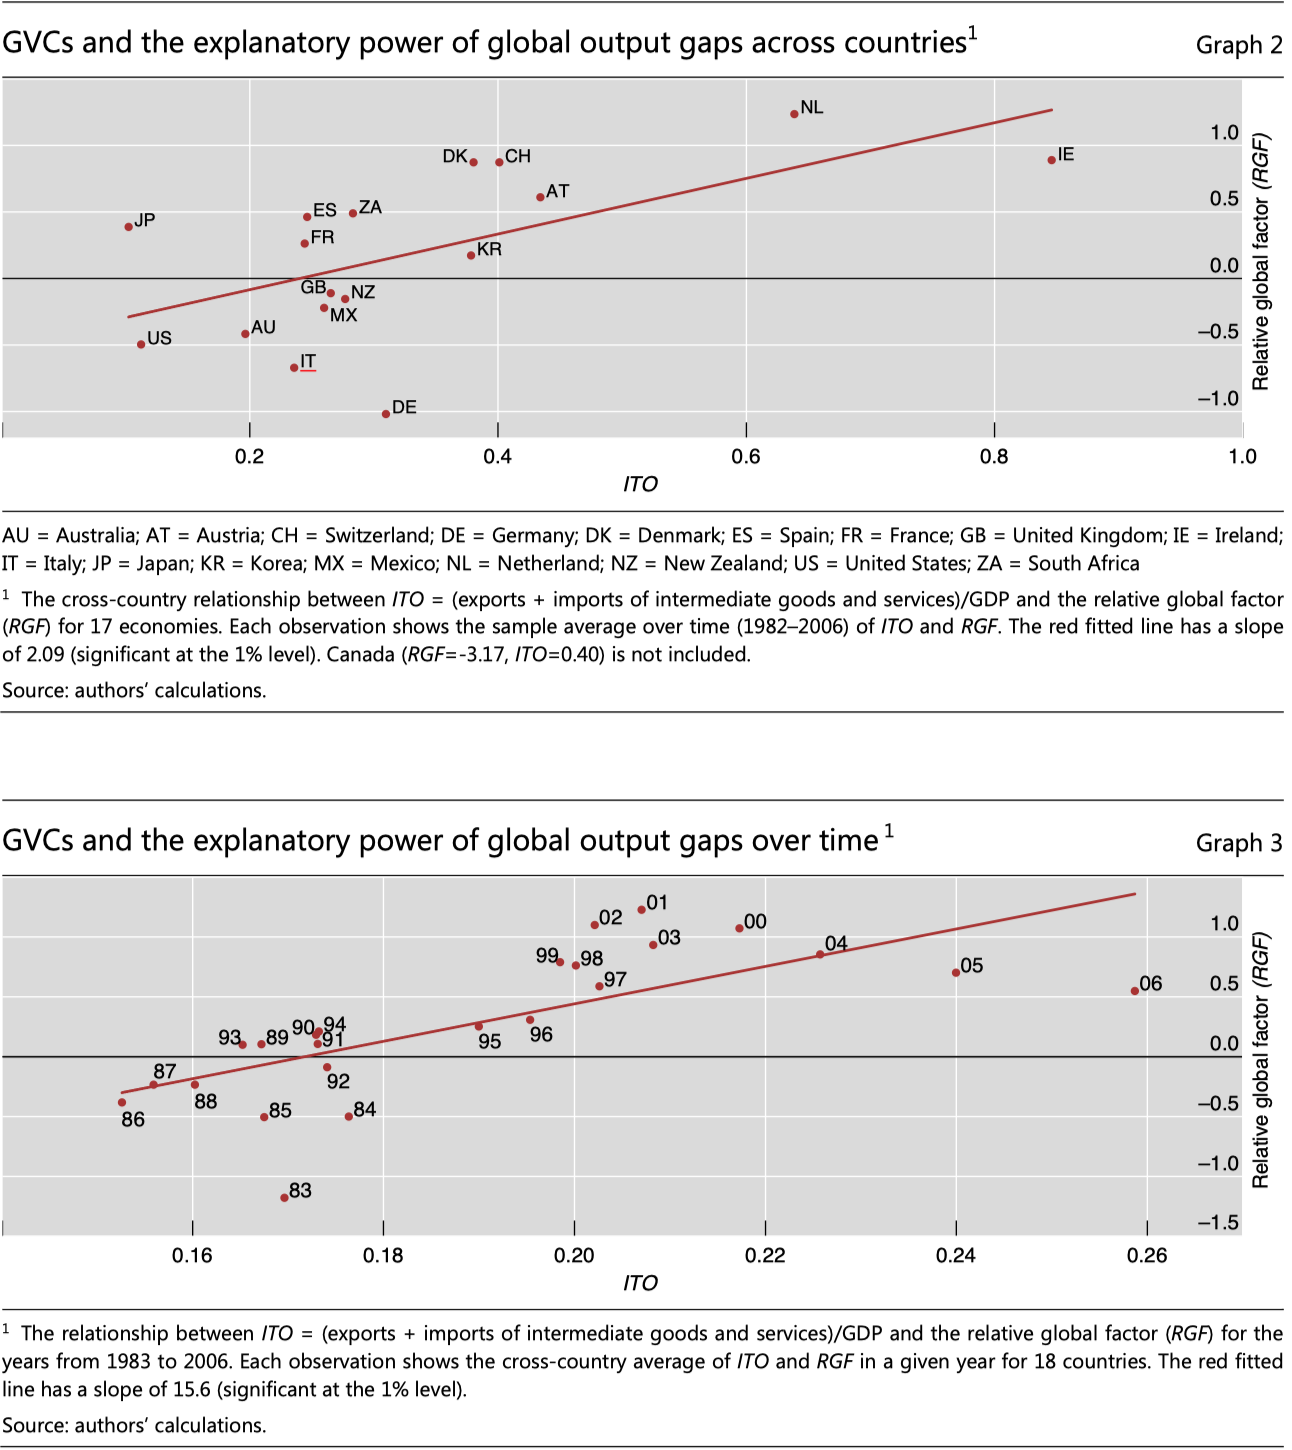
Source: BIS
Financial imbalances and the role of monetary policy
The changing face of inflation can lead to very important consequences for policymaking nowadays. The conventional wisdom is based on the assumption that monetary policy is neutral: it can influence only market rates but not the real factors which determine the level of real interest rates in the long run in a condition of full-employment – the so-called natural rate of interest, r*.
Generally, it is believed that if market rates are below, or above r* these real factors would influence them through inflation and expectations of market participants. The result is that real rates will tend towards r*.
This assumption is generally taken for granted and, through the Philips curve relation, central banks will assess the path of market rates and ensure they tend towards r*. If the rate of inflation is below the target rate, the level of output will be below potential and thus nominal interest rates will be lowered.
However, real factors may not play such a key role in determining real interest rates as aforementioned, and if the inflation process is changing due to the trends listed above, the meter used by central banks may no longer be reliable. If the Philips curve relation does not hold and thus inflation is not influenced by monetary policy, central banks may enter in a feedback loop: if the rate of inflation is below the target rate, nominal interest rates will be lowered; however, if the rate of inflation is exogenous, then, real interest rates will similarly fall and continue to do so as the central banks keep lowering the nominal rate.
The consequence is that monetary policy may not be neutral, instead, it would actively influence the path of real rates in the long run and thus the real economy. The present-day situation may be evidence of this.
Even after the economy recovered from the Great Financial Crisis – as determined by unemployment, GDP and other measures – central banks worldwide continued to push for lower interest rates given the low inflation. The result has been an historically bullish market in bond and equity markets which may be contributing to the build-up of global imbalances. If an asset price bubble somewhere in the market is in the making – a concrete possibility, given the extremely high valuation of equities and the massive amounts of negative-yielding debt – its burst would probably imply strong deflationary pressures – exactly what happened as a result of the GFC. The traditional wisdom would interpret this deflationary pressure as the result of a decline in the natural rate of interest, but it would be difficult to ignore the role played by past monetary policies.
For this reason, the “changing face of inflation” may be playing a key role in the Post-Bretton woods paradigm. Fiat money, through the unlimited expansion of credit, provides for the buildup of financial imbalances and at the same time allows to overcome them through massive stimulation; in fact, the system is very prone to a boom-bust cycle with the economy recovering from each bust with a higher than ever amount of debt. In this process the monetary policy, combined with the current regime of low inflation, plays a pivotal role, setting the stage for unlimited credit creation through dynamics similar to those presented above.
In conclusion, monetary policy based on inflation targeting may have persistently influenced economic cycles and thus the natural rate of interest and may need to refocus on frameworks that put greater emphasis on financial stability rather than those focused on a limited benchmark as inflation. Empirical evidence of the need to reconsider the framework of monetary policy is provided by the following data, presented in the Deutsche Bank 2017 Asset return study, which show the frequency of financial crisis over time defined as the occurrence on a 12-month rolling basis of any of the following:
Equity markets -15% YoY
FX -10% YoY vs US $
A Sovereign Default in that calendar year
Government Bond returns -10% YoY
Inflation +10% YoY

Source: Deutsche Bank
The graph clearly shows that financial crises have been very common in DM countries in the Post-Bretton Woods era and during wars – war financing provides for an unlimited credit creation just like the current paradigm – while the gold standard (1870-1910) and Bretton Woods (1950-1970) are characterized by relative stability.
During the gold standard regime, the money supply was linked to gold supply and central banks would generally maintain stable rates unless they were faced with the threat of gold outflows, which forced them to raise rates. The price stability of this regime, where central banks targeted convertibility, cannot be explained claiming that the market rate adhered to r*, given the central bank policy and the evolution over time in real factors similar to the one that occurred during the Great Moderation. Instead, it may prove that mostly stable nominal interest rates were reflected in real rates, providing, thus, empirical evidence of the impact played by the monetary policy on the economic cycle. Monetary policy aims to be neutral but empirical evidence shows it cannot: its attitude can set in motion new economic paradigms and reflexively influence the behavior of market participants, altering the path of real rates. This final graph highlights that shifts in monetary regimes, represented by the dashed lines, alter the level of real rates, influencing their path toward their supposed “steady-state equilibrium”.
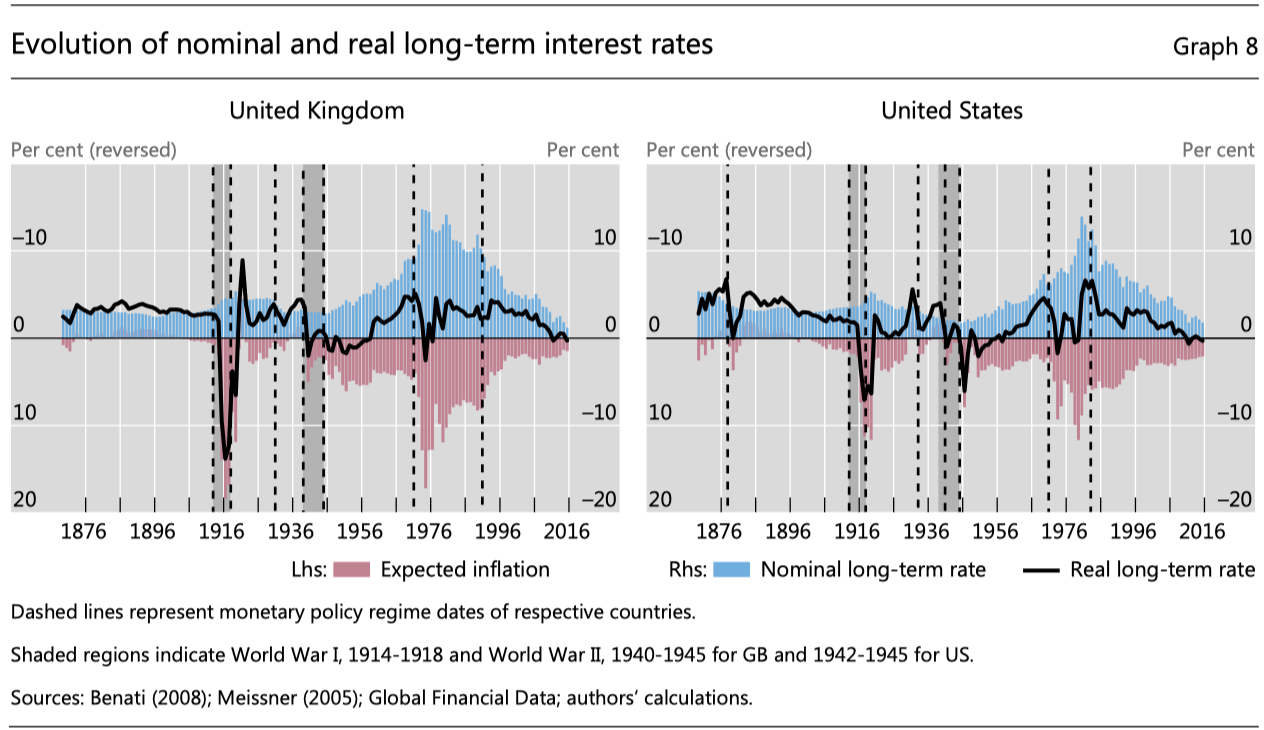
Sources: Benati (2008); Meissner(2005)


0 Comments