Introduction
We are now over a year and a half into the Covid pandemic. Disruptive as this exogenous shock has been, markets have quickly recovered, and proceeded to reach one new record after the other. More interestingly, several information technology stocks have stood the challenge without a bruise. Remote work has forced the world economy to rely on the likes of Apple, Zoom, Nvidia and others on a daily basis. Improved software and hardware boosted earnings, which in turn bolstered their stock returns after the March 2020 slump.
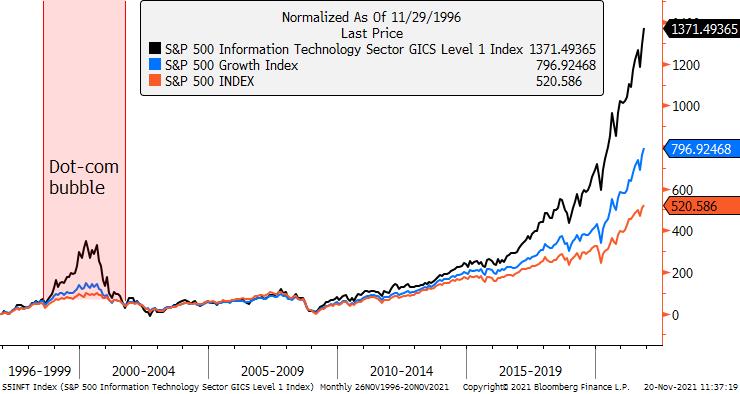
Percentage Appreciation on SPX Info Tech Index, SPX Growth Index and SPX
Source: Bloomberg, Bocconi Students Investment Club
Our goal in this article is to understand if the trend is here to stay in the face of a new market regime, namely with higher inflation as well as interest rates. Interest rates are a key element of the discounted cash flow valuation model, but compressed valuations are not the only factor that could lead to less than enthusiastic returns in the technology sector. A stock trading at a price-to-earnings ratio of 50 effectively offers an earnings yield of 2%. That 2% is very attractive if your alternative is a savings account or government treasury bond that offers roughly 0%. However, if interest rates climb, that 2% yield looks far less attractive. Moreover, the relatively longer equity duration of these stocks makes them more sensitive to the market scenario profiled as most likely.
Rising costs of raw materials — such as hard disk drives and semiconductors — only amplify the concert in the realm of tech stocks, often included in the growth category, as we have seen with the disappointing Q3 earnings for Apple. Heavy borrowing to boost future growth may be feasible for a little longer, but increased leverage can soon become too much of a burden.
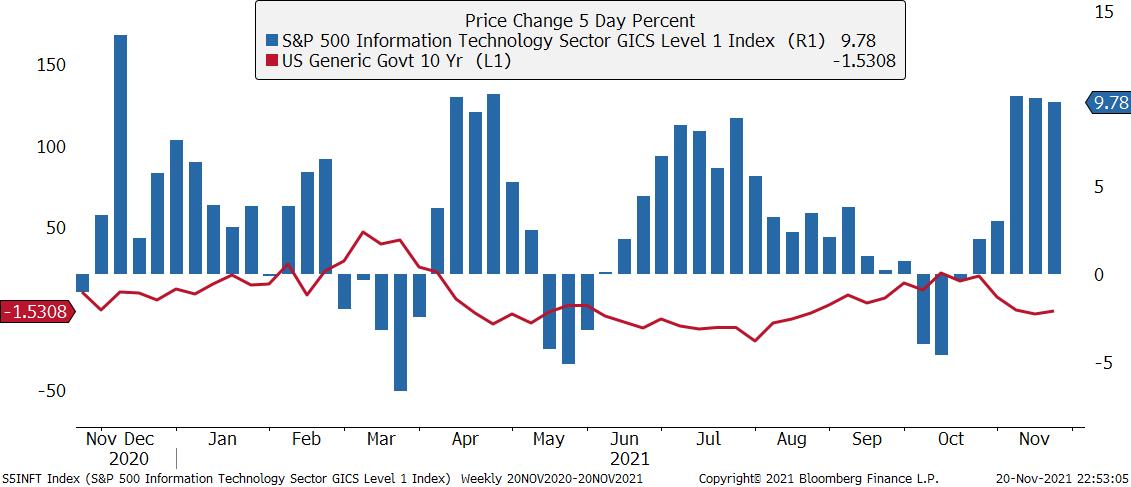
Source: Bloomberg, Bocconi Students Investment Club
We believe that, to navigate these complex market scenarios, investors are best served by a rigorous statistical approach able to identify the statistically relevant drivers of tech stock returns, and how they may be affected by changing market regimes.
Methodology
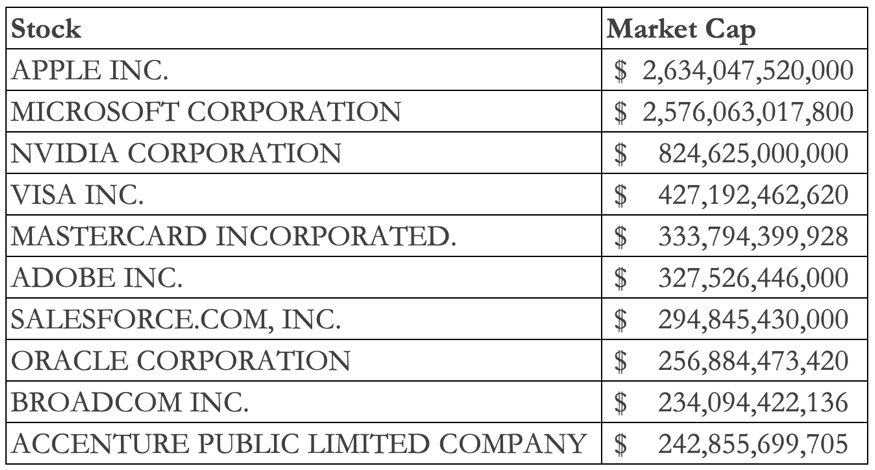
Before we delve into our econometric framework, let us briefly motivate our methodological choices. Firstly, we will rely on regression analysis. Price time series have been stationarized through conversion into return time series. As a proxy for returns on tech stocks we use the S&P 500 Information Technology Index (S5INFT). At the time of writing, the 10 biggest constituents (by market cap) are:
Rather than OLS, we prefer to use a weighted least squares (WLS) regression, which is robust to the presence of heteroskedasticity. Non-constant variance is a classic feature of return time series of financial assets, and the Breusch-Pagan test rejects the null hypothesis of no heteroskedasticity with a p-value of 0.02. We could also have applied a log transformation to the series, but then the coefficients would have been interpreted as elasticities, which would not be particularly insightful in out setting. The betas we obtain with the chosen framework are to be interpreted as the change in the response variable (percentage returns) for a 0.01 increase in the explanatory variable associated with the beta. The regressors are summarized in the following table.
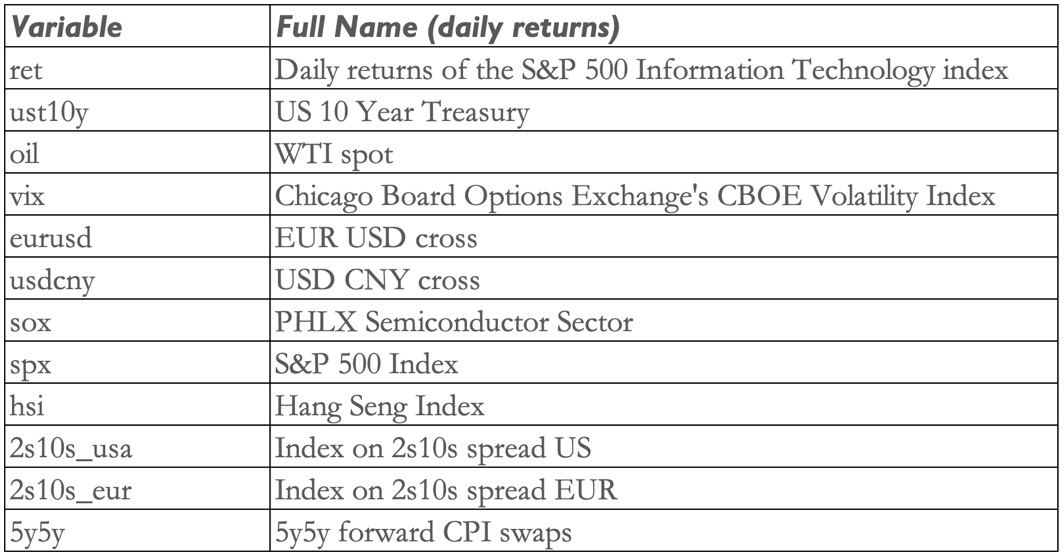
As discussed in the introduction, rates and inflation are perceived as important drivers of return on tech stocks. We include them in the regression through the 10-year Treasury rate, the 2s10s spreads on USD and EUR swaps, and the 5y5y forward on CPI swaps. We use the latter instead of CPI YoY data to proxy for inflation (expectations) because we need continuous data. Secondly, we add oil as a gauge of the macroeconomy, to investigate the role it might play in bullishness on the tech sector. The EUR USD and USD CNY crosses are added to analyse if relative strength between these relevant currencies is statistically significant. Finally, we include some market indices to assess the relevance of general market conditions on the tech sector. More specifically, the SOX index should allow us to understand how sentiment on semiconductor companies is related with tech stocks.
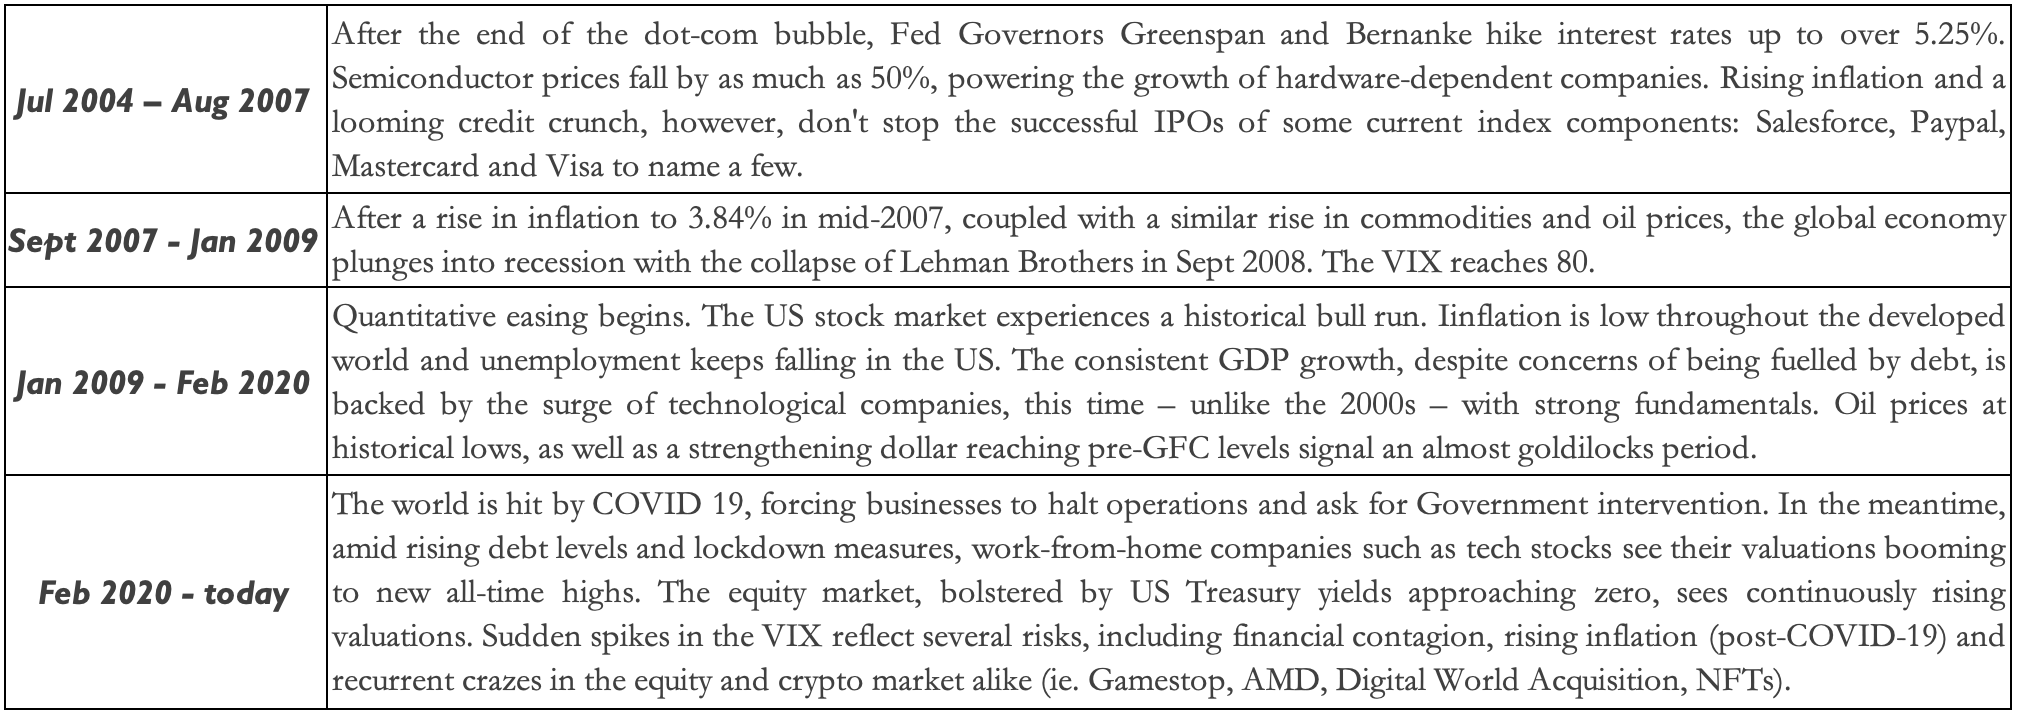
The period we chose for our regression analysis goes from 2004 to today. We start from 2004 to ensure that the dot-come bubble and its aftermath don’t act as confounding factors, undermining the robustness of our results. We further perform 4 separate regressions subdividing the data into three carefully selected periods, to investigate if/how the drivers change across market and economic conditions. The 4 selected periods are:
Finally, we employ a very powerful methodology to further analyze how the value and statistical significance of the coefficients change under different regimes, namely a Markov Switching model. The difference, compared to performing separate regression for subintervals of the considered time frame, is that in Markov Switching models, the regimes (in our case, 3) are unobservable and generated by a discrete ergodic first-order Markov chain. While this involves the drawback of not being able to fully understand what the regimes represent (i.e., which market conditions they are associated to), the silver lining is that Markov Switching models are known to lead to more accurate out-of-sample results, proving useful for forecasting.
Regression Analysis
We now move on to presenting the results of the first regression analysis, which covers the entire period (2004 to today). The coefficients and statistical tests are displayed in the table below.
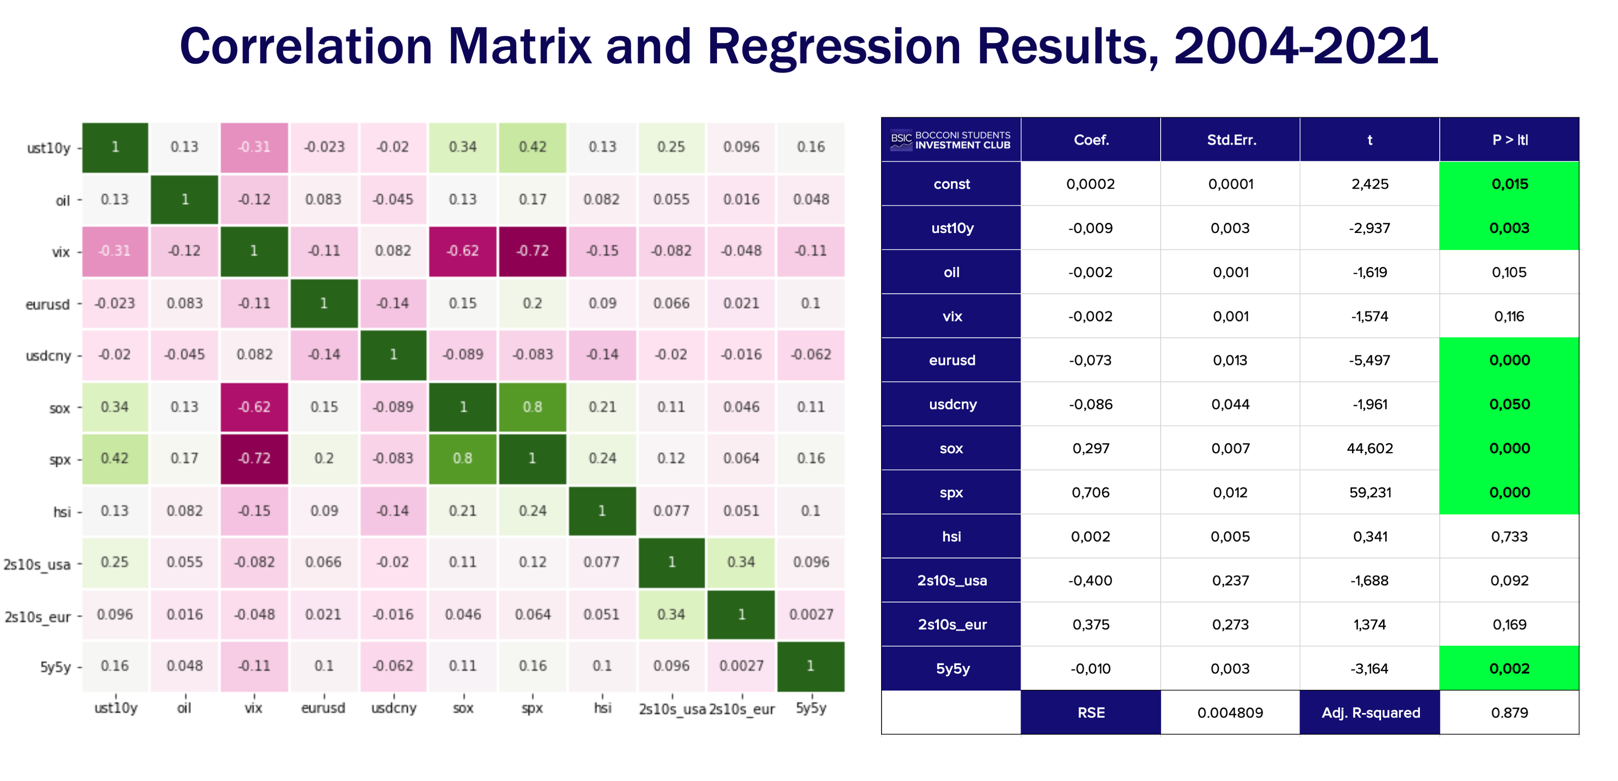
Source: Bocconi Students Investment Club
Despite having tested for multicollinearity and found that it is absent, we can find insights from looking at the correlation between the variables. As expected, there is persistent negative correlation among the VIX and the S&P 500, due to the leverage effect. US Treasury yields are positively correlated (0.4) with the US equity markets, while oil has been uncorrelated to most other variables (as well as inflation expectations), indicating that the commodity can often serve as a good diversifier in a portfolio. The PHLX Semiconductor Sector is strongly correlated (0.8) with the S&P 500. The index, whose performance is now heavily dependent on Taiwan and other Asian semiconductor-producing economies, has recorded a correlation of only 0.2 with the Hang Seng Index.
In the regression, the statistically significant variables are ust10y, eurusd, usdcny, sox, spx and 5y5y. While the two equity indexes will remain crucial variables in all the timeframes – here with positive coefficients of 0.297 and 0.706 respectively – we can see that the mainstream rates/inflation narrative remains consistent: we estimate negative betas for both. For instance, a 1% increase in the 10y Treasury is associated with a 0.88% loss in the S5INFT, ceteris paribus. Equally interesting is the statistical significance of the EURUSD (price of 1 EUR in USD) and USDCNY (price of 1 USD in CNY) crosses, both exhibiting negative coefficients. This seems to indicate that an appreciation of the dollar against the euro (lower EURUSD) supports American tech equities, while a relative USD strength against the yuan (higher USDCNY) weighs on the tech sector. This latter result is quite puzzling, as we would expect a stronger dollar to bring down the effective cost of imports from China and thus support American equities, but as we shall see in the last section, with the Markov Switching analysis, a more accurate result will support our intuition.
On another note, our linear regression has an adjusted R-squared of 0.80 and a RSE of 0.004809, indicating that we have captured most of the variability in the data.
Regressions on different time intervals
- Jul 2004 – Aug 2007
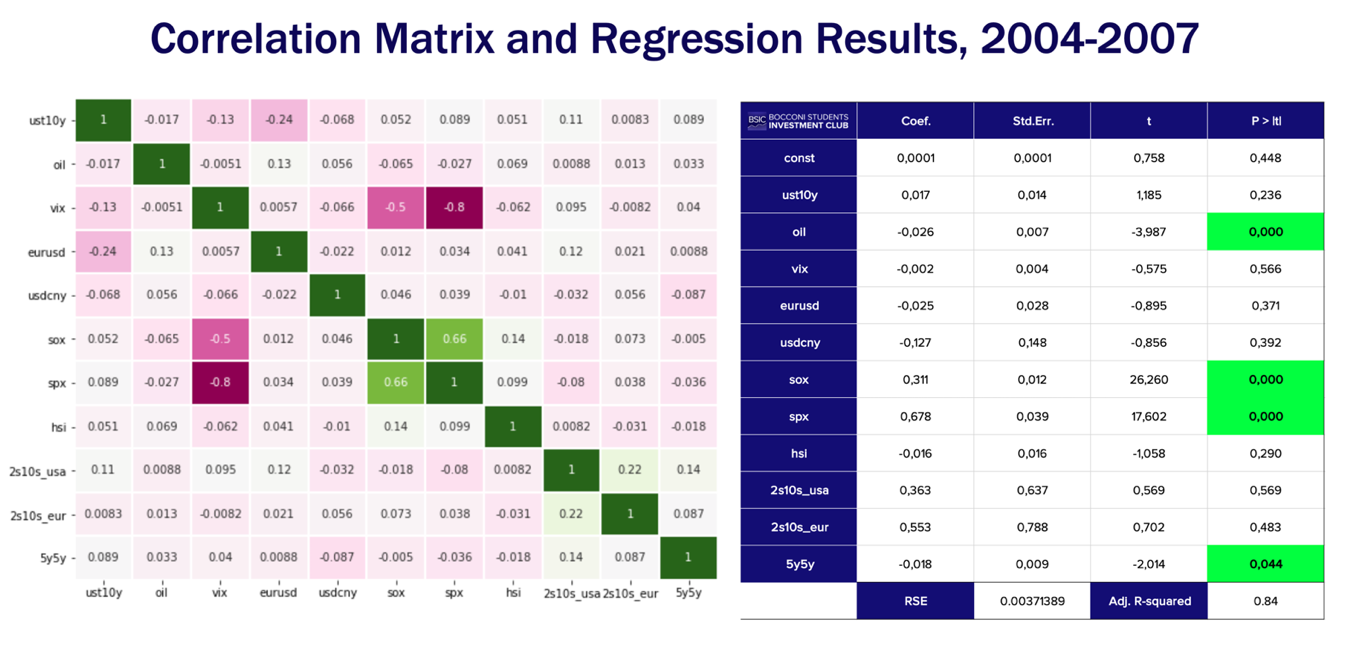
Source: Bocconi Students Investment Club
On the correlation matrix, US Treasuries show a much weaker correlation with the equity markets considered, perhaps defending the thesis that their diversification benefit was once stronger than today.
In the linear regression, we find as statistically significant oil, sox, spx and 5y5y. For oil, we estimate a negative beta of -0.0262, almost as strong – in absolute value – as the beta of the PHLX Semiconductor Sector index. Inflation, while still statistically significant, is found to be much lower at -0.0177. On balance, it appears that before the crisis of subprime lending, and the ensuing GFC, tech stocks were driven primarily by economic activity (instrumented with oil), inflation expectations, and general equity market drivers.
- Sept 2007 – Jan 2009
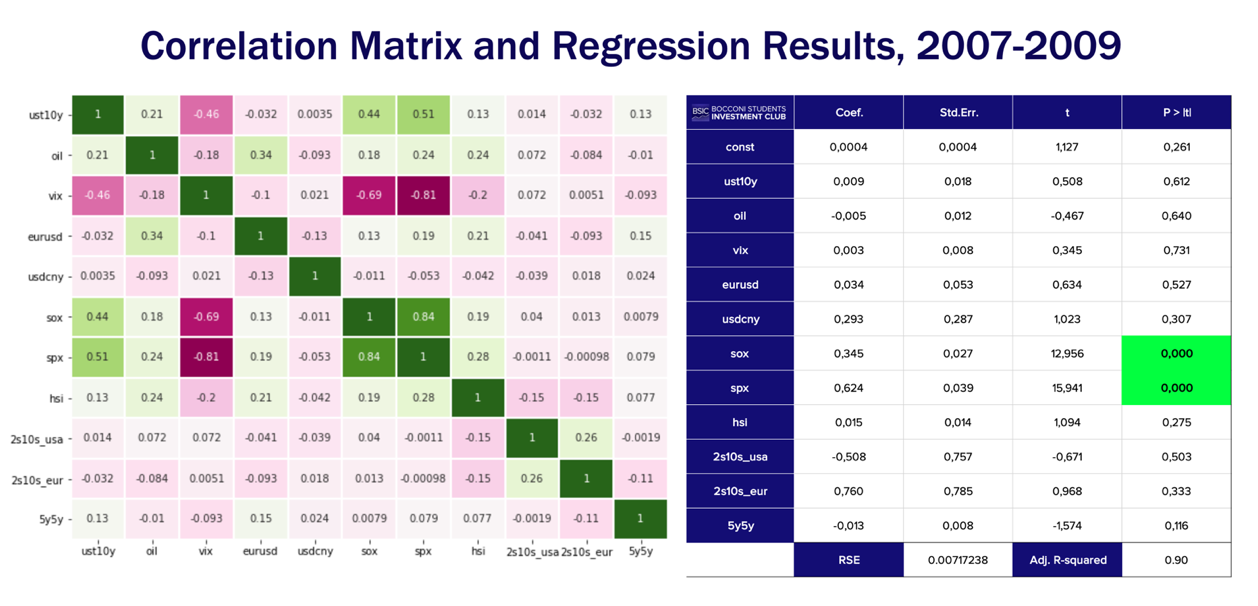
Source: Bocconi Students Investment Club
During the GFC, ust10y recorded a correlation of 0.5 with the S&P 500, while the only real “hedge” (negatively correlated to most assets) was the VIX. The Hang Seng increased its correlation to the main equity index compared to the previous period, while inflation remained uncorrelated to all variables. In the regression, most variables that were significant in the 2004-2007 interval now have p-values above the 0.05 threshold, therefore, we don’t find sufficient evidence to reject the null hypothesis of zero coefficient. sox and spx persist with relatively high betas.
- Jan 2009 – Feb 2020
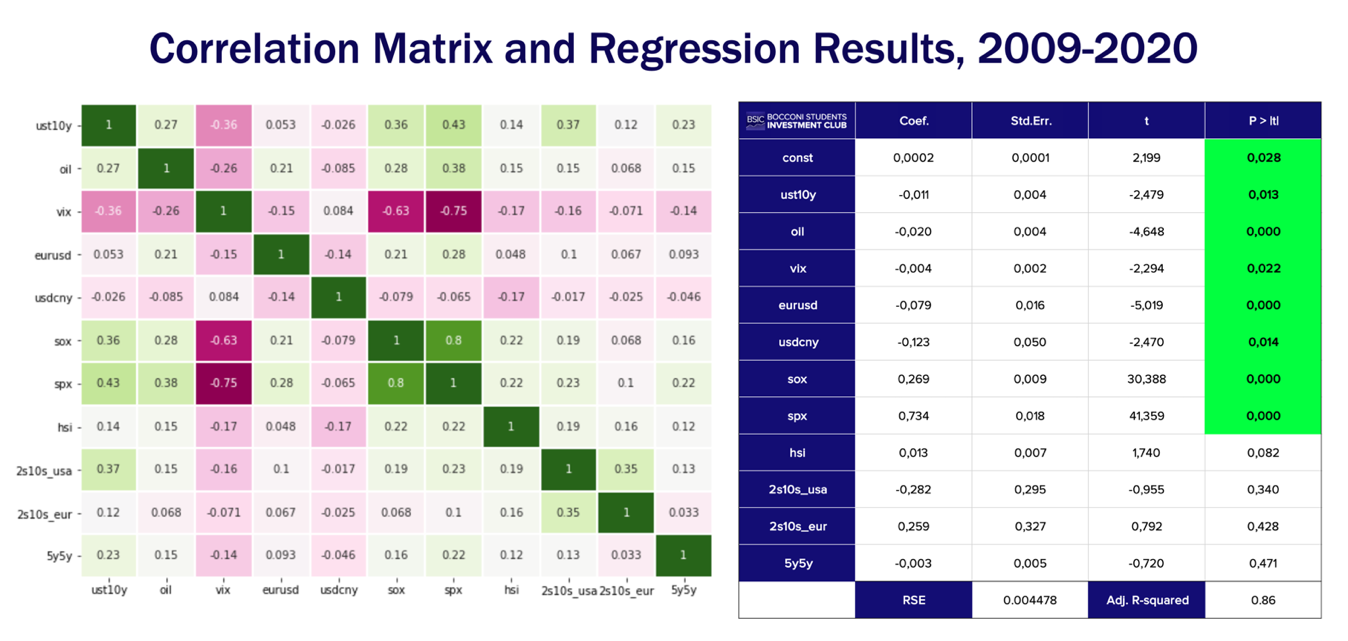
Source: Bocconi Students Investment Club
Oil, US Treasury rates and the S&P 500 persist in their positive correlation among them, in the ballpark of 0.25. The EUR/USD pair records for the first time a positive correlation of 0.28 with the S&P 500, while the USD/CNY remains (weakly) negative correlated with all other variables.
The statistically significant variables are oil, eurusd, sox and spx. In this time interval, oil retains a negative beta as it had before the GFC, while the betas of the FX variables are the most interesting. The negative beta of the EUR/USD (-0.0787) suggests that a stronger USD against the EUR boosted US tech stocks, ceteris paribus.
- Feb 2020 – Nov 2021
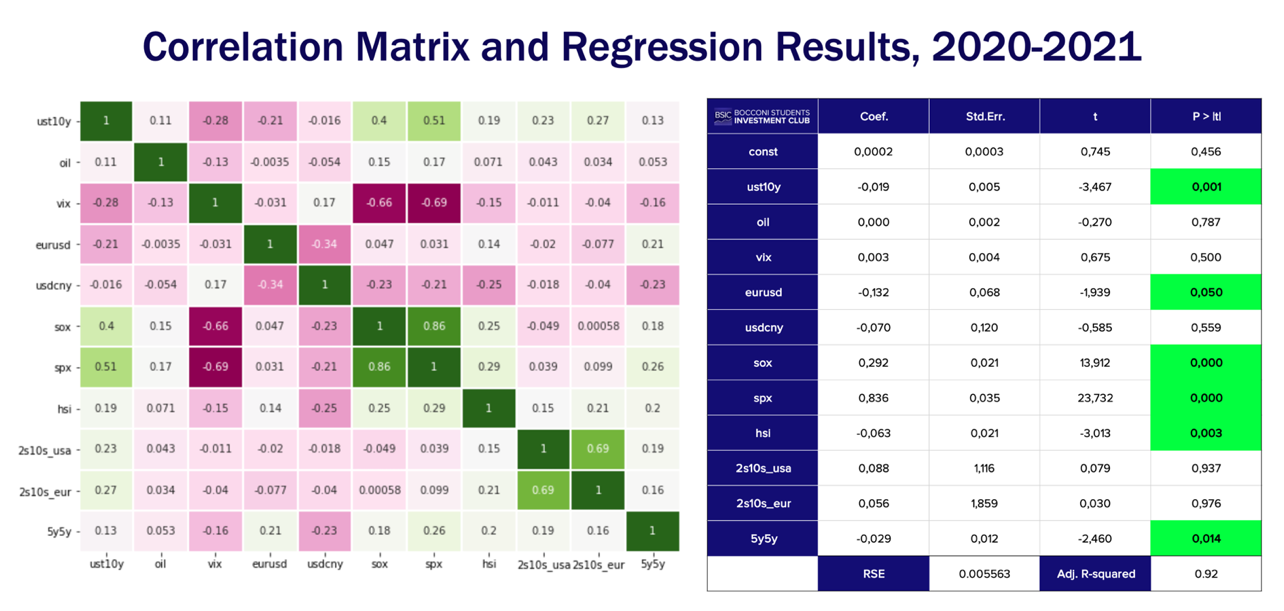
Source: Bocconi Students Investment Club
In the past 2 years, the correlation between the 2s10s US and EUR spreads has risen to a high of 0.7, indicating coordinated monetary policy. Oil, positively correlated with the S&P 500 in the previous intervals, is now largely uncorrelated. Interestingly, the EUR/USD and USD/CNY pairs record a negative correlation of -0.34.
After a 11-year hiatus, ust10y is seen as a statistically important variable of this regression, along with inflation, hsi (first time), sox, spx and eurusd. The beta of the former remains consistent with the previous period, while negative returns in the Hang Seng index correspond to higher returns of the S5INFT. The main takeaway is that the US 10Y Treasury has recently become a very relevant driver of losses for tech equities in US markets.
Markov Switching Analysis
As mentioned above, Markov Switching models have gained more and more traction both in academia and the industry in recent years, thanks to their simplicity of implementation and improvement in accuracy. In our setting, Markov Switching analysis will enable us to better understand how the drivers of return on tech stock change across regimes that are produced by an unobservable Markov process (see Song and Wozniak, 2020), as opposed to time intervals selected by us through macro/financial considerations. This should lead to an improvement in the robustness of our results, and possibly yield some more insight. The table below displays the results.
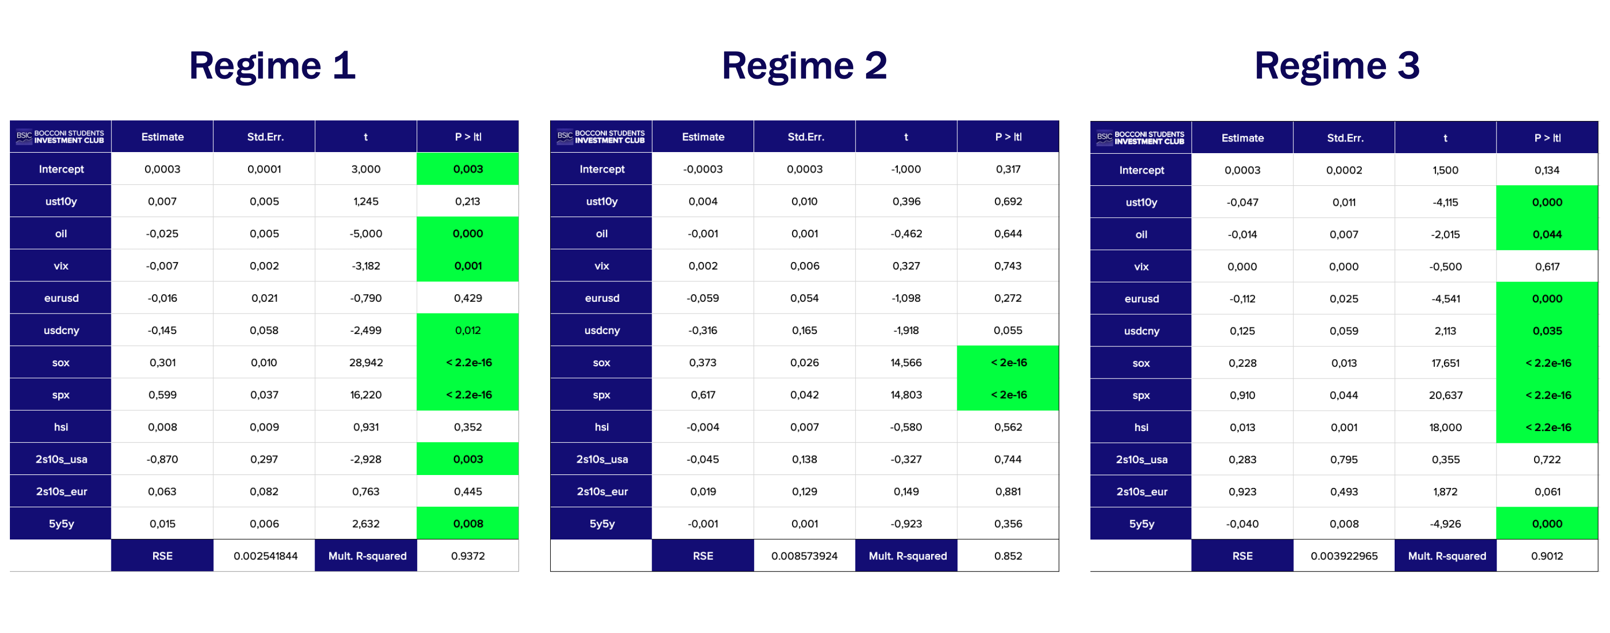
Markov Switching Regression Analysis
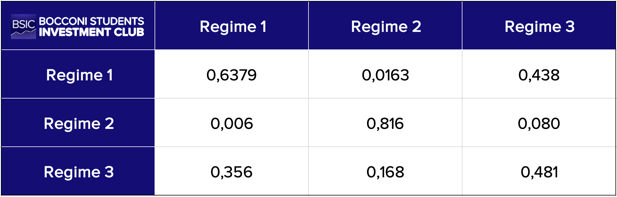
Transition probabilities matrix
Source: Bocconi Students Investment Club
The first regime is characterized by the statistical significance of the more macro regressors, including oil, usdcny, 2s10s_usa and 5y5y. We can interpret this as a market regime in which tech stocks exhibit enhanced sensitivity to the economy and to monetary policy, and where inflation is a positive driver. As we should expect, a steeper yield curve exerts downward pressure on returns, as do oil higher prices. This is consistent with the interpretation that higher rates and oil prices imply higher production costs for firms.
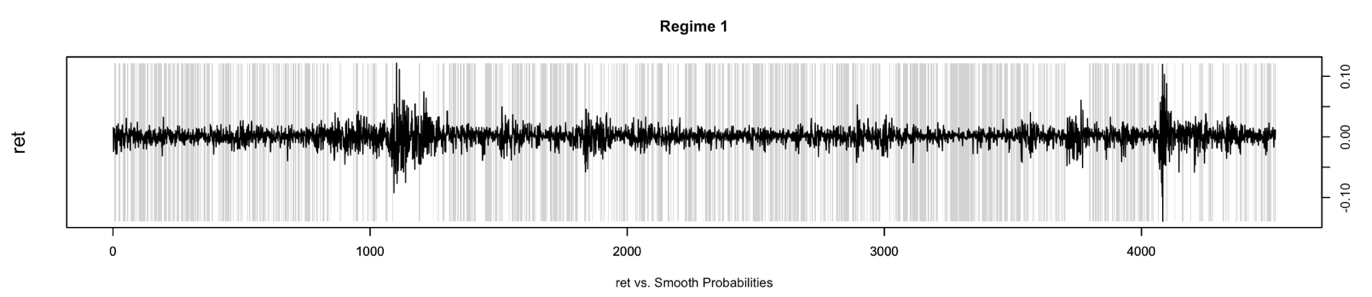
The model then identifies a second regime where only market indices seem to drive returns on tech stocks. Specifically, positive coefficients are estimated for the S&P 500 and the PHLX Semiconductor Sector Index. Finally, the third regime complements our analysis of the first, and it explains some of our earlier results. More specifically, we find a negative and statistically significant coefficient for the 10Y Treasury. This is the only regime in which the variable has p-value below our confidence level, and the fact that it is negative confirms our expectation about the effect of rates on tech. Another important insight is that the USDCNY cross has a positive statistically significant coefficient. This legitimizes our opinion that, under certain circumstances, a dollar appreciation against the yuan should support American equities. However, as we can see from the pictures below, regime 1 is the most frequent one, and in that regime the coefficient is negative (and statistically significant). Thus, we conclude that in general, a weaker yuan against the dollar is negative for the tech sector.
Finally, we show below the probabilities of being in a specific regime, and the historical inference of the same. We remark that on the x axis, dates should be displayed, going from 2004 to today, with daily observation.


Source: Bocconi Students Investment Club


0 Comments