Introduction
Abundance of liquidity thanks to the coordinated stimulus injected by the world’s major central banks during the past year has triggered a renewed interest in gold due to its role of store hold of wealth. This article is part of our series on the impact of NIRP on asset classes. We begin with an historical analysis of the price of gold in order to understand its main drivers, then we analyze its diversification benefits in a portfolio, and finally we speculate on its future outlook.
A historical perspective on the drivers of gold
Gold has been regarded as a store hold of wealth throughout history. To confirm whether it has been able to preserve purchasing power, we analyze the evolution of its price in £ with respect to the consumer price index of the United Kingdom starting in 1256; in addition to this, we carry on a similar analysis in the United States for its price in $ starting in the early 20th century. The results are displayed in the following graphs.


We notice that historically gold has maintained its purchasing power, however, over time there have been significant fluctuations in its inflation adjusted price; in particular, during gold standard periods its inflation adjusted value tended to decline and was often subject to sudden spikes when the currency was left floating.
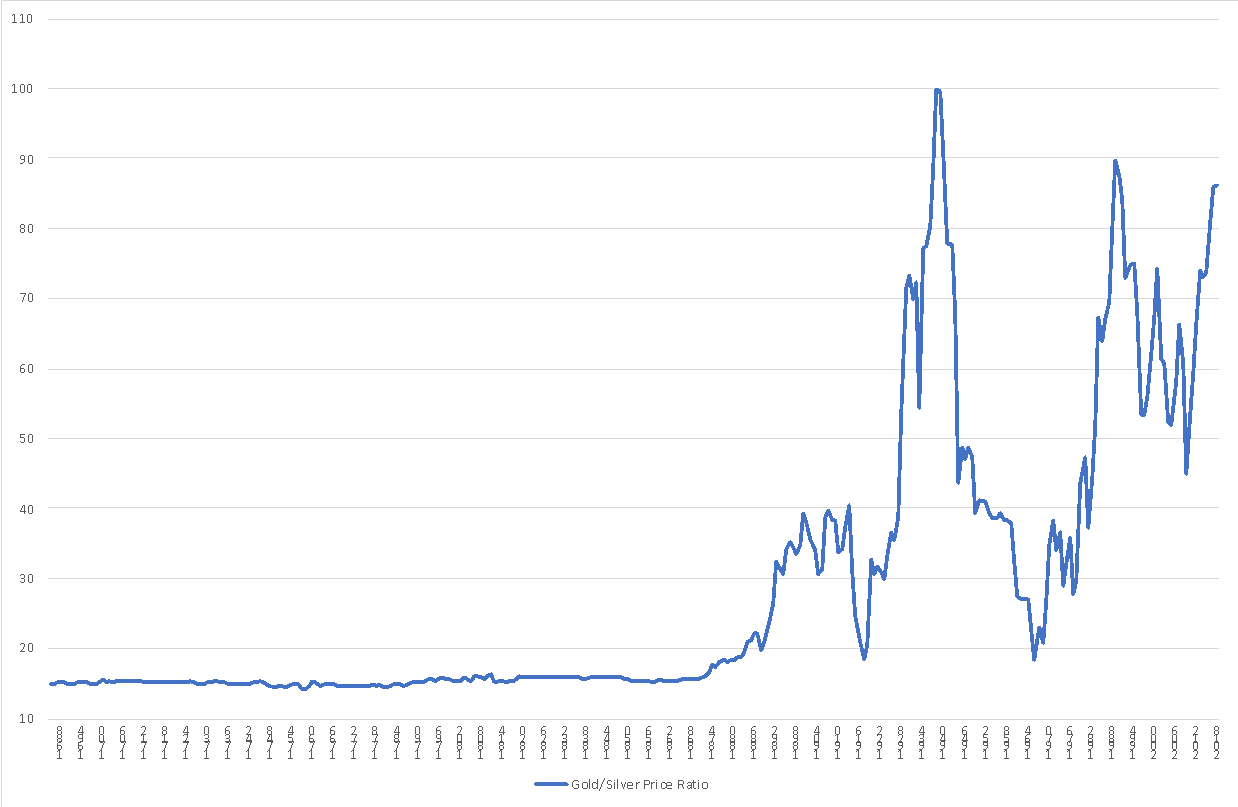
Silver is often associated with gold because it has been widely used as a store hold of wealth in the past, in fact, many monetary systems fixed the price of their currency in terms of silver. In the graph below we report the evolution of the gold to silver price ratio; historically, this ratio has been close to 15 for centuries (even millennia: The Roman Empire set it at about 10), however starting from the late 19th century, it has been characterized by major fluctuations. In fact, the value of silver with respect to gold progressively declined, due to large discoveries during the 19th century; in addition to this, there have been episodes of speculation like the cornering of the silver market in the 1970’s. The resulting instability in the value of silver since the 20th century, led to the demise of silver standards, and today its role as a store hold of wealth is not comparable to the one of gold. As a result, in what follows, we will focus on the behavior of the price of gold, and we try to understand its evolution in light of its ability to preserve wealth over time.
To fully understand the evolution of gold prices over time, we need to determine which are its main drivers and then use them to model gold’s price. To do so, we notice that gold has the following characteristics: 1) it maintains its purchasing power, 2) it is an asset that carries no income, 3) it is an asset with a potentially infinite maturity. On the basis of such characteristics, it seems that gold resembles an inflation adjusted asset, which brings no coupon, has a long maturity, and is free of default risk. Consequently, it is probable that its market price will be affected by the level of long-term real interest rates on risk-free assets; in fact, this real interest rate can be considered as the opportunity cost of holding gold. This implies that an increase in such rate tends to decrease the price of gold, and vice versa. As a result, starting from the nominal price of gold, we can decompose it and obtain its real component, which we would expect to be constant over time, as follows:

Given that gold maintains its purchasing power, we can derive this formula simply assuming that the market will compute its future payoff according to expected inflation and will then discount it by a long-term risk-free interest rate. Equivalently, the price of gold is discounting its real value, with a real long-term risk-free interest rate. In the equation above, “t” corresponds to the duration of gold, which can be computed from the market with a regression between the price of gold and the real interest rate. Having done so, we can compute the real price of gold, which is displayed in the graphs below, both for the UK and the US.


In real terms, the value of gold seems more stable than in nominal terms; however, it is still subject to variations that tend to be persistent over time. In this respect, we notice that most of them are attributable to changes in the exchange rate of the currency the price is being measured in. In fact, it can be expected that a currency appreciation would lead to a decrease in the price of gold and vice versa. For example, after 1950, the UK Pound faced a large depreciation as it lost its global reserve currency status, and consequently the real and nominal prices of gold in £ sharply increased. In the following graph, we show the 10-year rolling correlation between the real price of gold and the nominal effective exchange rate for the UK and US.


The correlations overall are negative and close to -0.5 for both countries, however, the rolling correlations are time-varying. This variation may be due to other structural factors influencing the price of gold in the short run; for example, the introduction of Gold ETFs in the 2000’s made Gold easily accessible to many retail investors and probably contributed to its rally leading to the GFC.
In order to include the effect of the exchange rate, we then carry on a regression between the log real price of gold and the nominal effective exchange rate for both UK and US; the residual variation of each regression is displayed as a percentage of the log real price of gold in the graphs below. The residual variation is still subject to fluctuations, but overall, it is quite stable.


As a result, we can reasonably conclude that the main factors influencing the price of gold are: 1) the real interest rate (which in turn depends on the nominal interest rate and on inflation expectations), and 2) the exchange rate.
The role of gold in a portfolio
In light of the drivers that we have just mentioned, we can analyze the historical performance of gold; the following tables display the returns of several asset-classes and the level of macro-economic variables each decade during the past century in both the US and UK.


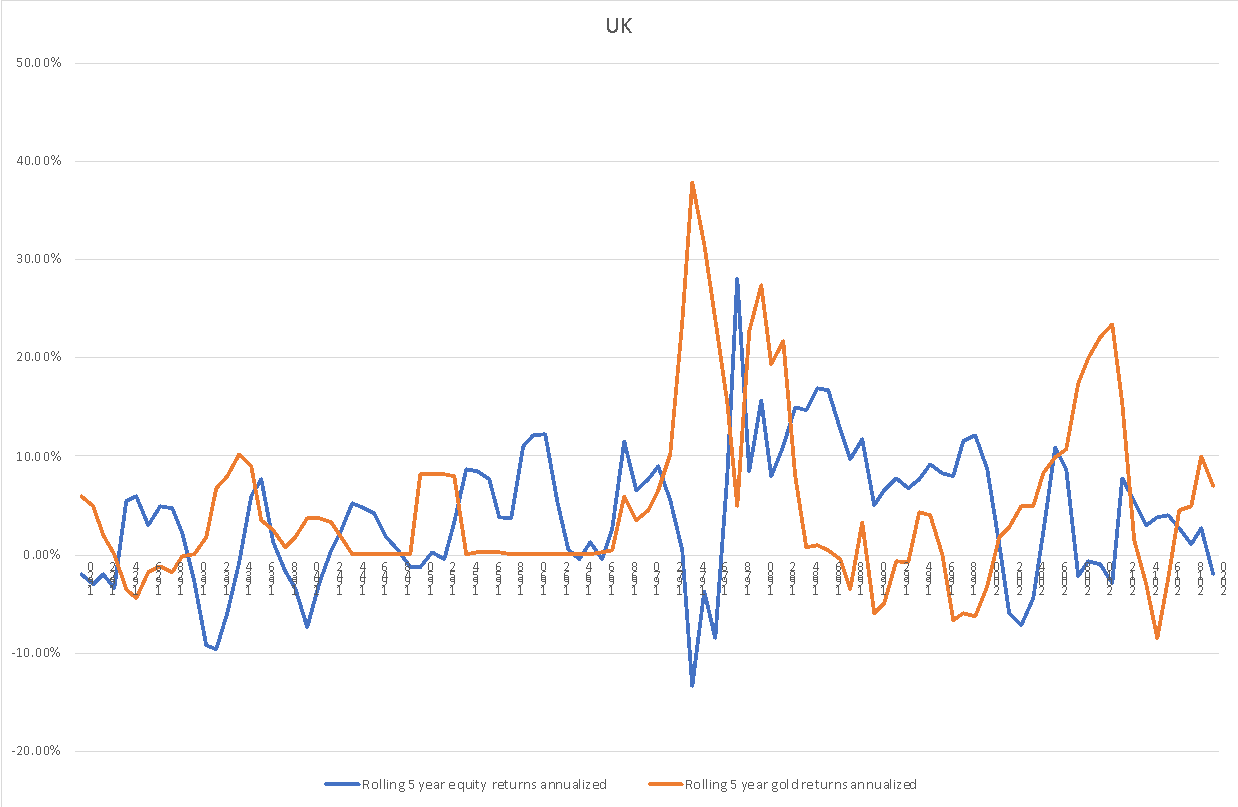
We notice that strong gold returns are concentrated in stagflationary environments, like the 70’s, in both the UK and US, when monetary policy fails to stimulate the economy and leads to high inflation and low growth. In such periods, owning gold can be a very effective edge against both the equity and bond component of a portfolio. In this case, gold’s performance can be interpreted as the result of declining real interest rates and currency depreciations. Gold also displays positive returns in reflationary environments after deleveraging, including the 1930’s, the 1950’s and the 2000’s in UK and the 2000’s in the US; in this case, gold’s performance is mainly attributable to declining real interest rates, which sometimes are combined with currency depreciations, as it was the case for the UK. In such environments, gold can be extremely useful to diversify the risk of equities. In the following graph, we display the 5-year annualized rolling returns for gold and equities in the UK. This further emphasizes that gold tends to deliver extraordinarily positive returns in short time periods, when equities do not usually fare well. This is also reflected by a negative correlation between gold and equities of -0.2, over the past 100 years for the UK.
In conclusion, gold should be able to diversify certain risks of a portfolio and enhance its returns while reducing its drawdowns. This can be evidenced from the following simulation which compares the performance of a traditional 60-40 portfolio, split between equities and treasuries, with an equal portfolio that halves the bond component and invests the remaining in gold.

Future outlook for gold
We now analyze the likely evolution of the main drivers of the price of gold, in order to assess its future outlook. With respect to real interest rates, currently most Western advanced economies (US, Europe, Japan), feature very low or negative long-term real interest rates. This is driven by: 1) low nominal interest rates on long term debt (even though they have been recently increasing), and 2) inflation expectations that are rising, and getting closer to the central banks’ target of 2%. Currently, there is a lot of uncertainty on the future path of inflation expectations: many Western countries, in particular the US, have approved stimulus packages directed towards households, that seek to replace lost spending. This stimulus is substantially different from the one approved post GFC, which was meant to avoid a credit contraction, and consequently may have a different inflationary impact. On the other side, the path of nominal interest rates will likely depend on the policy stance of central banks: in Europe the ECB has recently pledged to support bond markets, while the FED has so far remained on the sidelines. However, both central banks are still committed to supporting the economy, even if inflation temporarily increases as the recovery gathers pace, so we would overall expect interest rates to remain close to their current levels. Turning to exchange rates, there is remarkable uncertainty because the past year has witnessed a substantial increase in the debt levels of all Western governments which will likely keep on rising in the future; in particular, the US is dealing with a record supply of Treasuries, that so far has been largely absorbed by the FED. In conclusion, in light of such a high uncertainty and considering that central banks in Western economies are in a very tight spot, gold may provide diversification benefits in a portfolio against both rising inflation expectations and currency depreciations.


0 Comments