Introduction
Momentum has long proven to be a reliable and empirically supported factor in equity strategies across developed markets (DM). Seminal work by Jegadeesh and Titman (1993) found that stocks with strong past returns over a 3–12 month period tend to continue outperforming in the following months. Later, Carhart (1997) incorporated momentum as a fourth factor in his asset pricing model, further validating its role in explaining stock returns. However, in the context of emerging markets (EM), studies by Rouwenhorst (1999) and Griffin, Ji, and Martin (2003) did not reach the same conclusions, highlighting greater sensitivity to transaction costs and weaker momentum signals. This article revisits the question of whether momentum can serve as an effective foundation for strategy construction in emerging markets considering evolving market structures.
We propose 3 complementary long-only momentum variations: a standard long-only momentum portfolio, a risk-weighted long-only strategy, and an idiosyncratic momentum strategy. This approach allows for better control over portfolio volatility and drawdowns, which tend to be more severe in EM. It also allows us to eliminate the costs associated with short selling in EM, with transaction costs being one of the main hurdles encountered in previous studies. Finally, multiple long-only momentum approaches help diversify factor exposure and reduce reliance on a single type of signal, smoothing out performance across different regimes.
Factor analysis on emerging markets
Our strategy focuses on the MSCI EM Index (EEM), but before diving into the trading strategy we propose a factor analysis on the index, comprised of a 5 factor Fama-French regression + Momentum, also exploring the role of DM volatility, through the VIX, and EM uncertainty in explaining EEM excess returns. The regression was done on logarithmic excess returns to stabilize variance and allow for more interpretable coefficient estimates.

Figure 1: Regression coefficients
All considered factors are statistically significant drivers of excess returns. Across the entire index, only value showed a positive association with returns, indicating a value premium effect. Over the last 15 years, on average:
- Smaller companies underperform, suggesting a strong preference for large-cap stocks in EM.
- Companies with high book-to-market ratios (value stocks) tend to outperform growth stocks.
- Less profitable firms outperform, indicating a reverse profitability premium in EM.
- Firms with lower asset growth (i.e., more conservative investment) outperform.
- Stocks with weaker past momentum perform better, suggesting momentum reversal dynamics.
Unsurprisingly, EM Uncertainty has a negative correlation with returns and the VIX exhibited a significant negative relationship, confirming the strong influence of global risk aversion. However, in our formal evaluation of the added value of EM uncertainty using an F-test, we observe that it does not significantly enhance the model’s explanatory capability. The adjusted R² shows only a slight increase, and the p-value related to the inclusion of EM Uncertainty is above the significance level. This indicates that, EM-specific risk is primarily overshadowed by existing risk-factors, and that the inclusion does not add explanatory power to the model. The VIX on the other side does add statistically significant explanatory power suggesting that EM is more sensitive to global uncertainty rather than EM specific uncertainty. This is likely due to the investor base being very exposed to the US.
The strong relationship with the VIX becomes evident when comparing average returns during high-volatility months, defined as the top 25% of months by VIX levels, to those in medium- and low-volatility periods. During non-shock months, the average excess return is positive, around 1.3%, while during VIX shock months, it turns negative, averaging about -1.8%.

Figure 2: Rolling beta of VIX and EM Uncertainty
To ensure the reliability of our regression results, we ran Augmented Dickey-Fuller (ADF) tests on the residuals from the VIX and EM Uncertainty models. The results confirmed that the residuals are stationary, which supports the presence of a stable long-run relationship between the variables. This suggests that the regressions are not spurious and that each factor provides meaningful explanatory power over time. To test for multicollinearity, we have computed the VIF and correlation matrix of the factors and found that multicollinearity is not present in the model.
Index construction
The goal of replicating the EEM index is to construct a reliable and transparent proxy for Emerging Market (EM) equity returns that can be used for subsequent analysis, including factor regressions and strategy back-testing. To achieve this, we developed two versions of the index:
- An equal-weighted replication, where each stock in the index is assigned the same weight, regardless of its market capitalization.
- A value-weighted replication, where stocks are weighted by their market cap in alignment with the methodology used by the actual EEM ETF.
The replication is based on publicly available data on index constituents and daily price returns. The constructed indices are then compared against the official Net Asset Value (NAV) of the EEM ETF to evaluate the degree of tracking accuracy. The rationale behind this replication is that it provides a customized dataset that facilitates more precise analysis of EM returns and momentum strategies, as we are now able to trade individual constituents throughout history.
To replicate the EEM index, this article adopts an annual rebalancing frequency, in contrast to the official EEM ETF, which follows a more frequent rebalancing – typically occurring quarterly or semi-annually. The choice of annual rebalancing is primarily driven by data availability. Additionally, to ensure that the performance of the replicated portfolios reflects the real-life constraints, transaction costs are incorporated at each rebalancing date. Specifically, a one-time cost of 15 basis points (0.15%) is applied to the entire portfolio on every rebalancing date. This adjustment simulates the impact of trading costs that would be incurred when rebalancing large positions in emerging market equities, which tend to be less liquid and more expensive to trade compared to developed markets.
 Figure 3: 2015-2025 index construction
This figure displays the cumulative returns of the EEM NAV compared to two replication models: a value-weighted and an equal-weighted portfolio. As expected, the value-weighted replication closely tracks the ETF NAV especially the first years, owing to the use of the same weighting methodology and same constituents. The tracking error is primarily attributable to the difference in rebalancing frequency especially as time goes on. In contrast, the equal-weighted model diverges more significantly over time due to its structural deviation from the index’s construction.

Figure 4: Correlation VW index and ETF NAV
The table highlights a significant performance gap between the Value-Weighted model and the actual EEM NAV: the annualized return of the model is only 0.15%, compared to 2.62% for the ETF NAV. This underperformance is also reflected in a much lower Sharpe Ratio (0.01 vs 0.15). However, despite the difference in total returns, the correlation between the two series remains high (0.92), and the beta is close to 1 (0.83), indicating strong co-movement over time. This suggests that, although the model materially underperforms the benchmark, it still captures the general return dynamics of the ETF. Therefore, it can be used as a valid proxy for EEM in further strategy development, with the caveat that any excess return results should be interpreted relative to the model’s known underperformance.

Figure 5: Daily tracking error

Figure 6: Rolling beta vs EEM NAV
The first chart displays the daily tracking error between the value-weighted model and the EEM NAV. The error fluctuates around a mean close to zero, with many observations contained within ± 2 standard deviations. However, there is noticeable time-varying volatility in the tracking error, especially from 2021 onward, where the model exhibits more frequent and larger deviations from the NAV. This suggests that while the model generally follows the ETF closely, there are periods of instability likely due to structural differences (e.g. annual rebalancing, missing constituents, or country-specific shocks).
The second chart shows the 60-day rolling beta of the model relative to the EEM NAV. The beta remains consistently below 1, averaging around 0.8–0.9, which confirms the earlier result from the static regression. This indicates that the model tends to underreact to movements in the benchmark. Notably, beta becomes more unstable during periods of market stress (e.g., in 2020 and 2022), highlighting moments where the model’s replication accuracy weakens. Overall, while the high correlation supports the use of the model as a benchmark proxy, both charts underline the importance of interpreting results within the limits of its tracking efficiency and sensitivity to the index.

Figure 7: Number of stocks in VW index
Momentum
One of the key objectives of this paper is to evaluate whether the momentum effect in emerging markets is as robust as those observed in developed markets. While the traditional cross-sectional momentum literature often focuses on long-short implementations, the specific characteristics of emerging markets present significant frictions that make short-selling impractical or even infeasible.
These include low liquidity, high transaction costs, limited availability of securities for borrowing, and regulatory restrictions on short positions in several countries. For this reason, we focus on a long-only implementation of momentum, which are both more realistic from an execution standpoint and more aligned with how institutional investors typically gain exposure in these markets.
To further enhance the robustness of the analysis, we explore three complementary long-only variations:
- A standard long-only momentum portfolio
- A risk-weighted long-only strategy
- An idiosyncratic momentum strategy
Together, these implementations allow us to assess not only the presence of momentum in emerging markets but also whether risk-adjusted and factor-neutral versions of the strategy offer more consistent or investable return profiles.
Standard long-only momentum portfolio
The ranking signal is defined as the 12-month cumulative return excluding the most recent month, a common specification in the momentum literature to avoid short-term mean reversion.
At each rebalancing date, stocks are ranked cross-sectionally based on this signal, and only those in the top 5% percentile are selected for inclusion in the portfolio. The portfolio is rebalanced every two months, using the latest available signal at each rebalancing point.
Between two rebalancing dates, the selected stocks are held with equal weights, and daily portfolio returns are computed as the simple average of the constituent stocks’ returns. Trading costs of 15 basis points are subtracted from the first day’s return after each portfolio rebalancing. The resulting return series captures the performance of a long-only momentum strategy in emerging markets, compared to our value weight index and the EEM NAV.

Figure 8: 2016-2025 long only returns

Figure 9: Main statistics long only strategy
As can be seen from the chart, the long-only momentum strategy outperforms both the benchmark and our index. The long-only momentum strategy has an average annualized return of 7.55%, significantly higher than the 2.49% observed for EEM NAV. Importantly, the strategy achieves this with a slightly lower daily volatility (0.99% vs 1.05%), resulting in a Sharpe ratio of 0.48 — more than three times higher than that of the benchmark (0.15). These differences underline the efficiency of momentum in capturing return asymmetries. Furthermore, the momentum strategy exhibits a negative skewness (−0.64) and high excess kurtosis (8.04), reflecting a return distribution with fat left tails and occasional large drawdowns — a common trait among momentum portfolios. In contrast, the NAV’s distribution is more symmetric (skewness −0.33) and less leptokurtic (kurtosis 3.99), suggesting a less extreme but also less rewarding return profile.
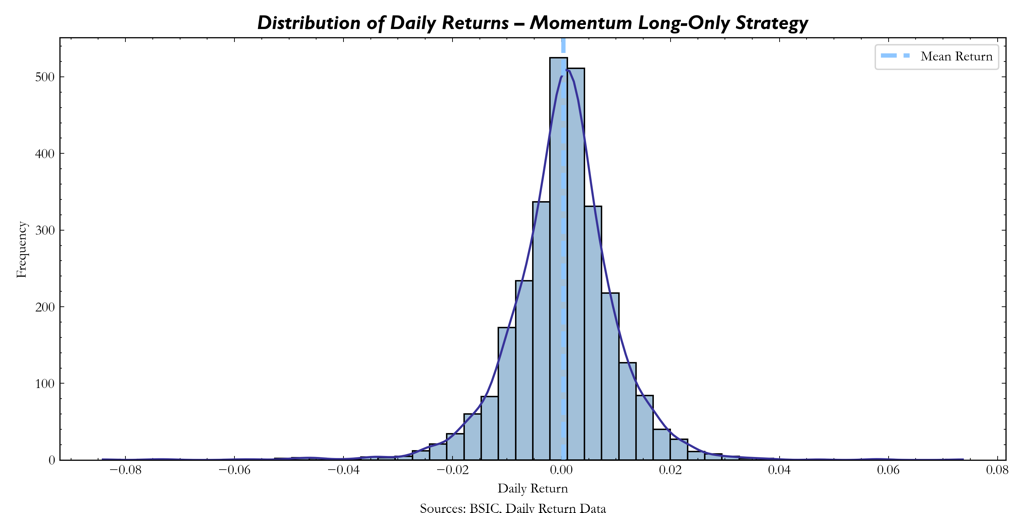
Figure 10: Daily distribution of long only strategy returns
Turnover is consistently high, averaging around 0.56, as indicated by the dashed horizontal line. This implies that over half of the portfolio changes at each rebalance date, translating into high transaction costs.

Figure 11: Turnover of long only strategy
The next step in this analysis is to regress the strategy excess returns on the Fama-French 5 factors and the Momentum factor to see whether the strategy produces alpha or whether we are just harvesting risk premia.
The model explains a substantial portion of the strategy’s variance, with an R-squared of 84.2% and an adjusted R-squared of 83.3%, indicating that the included factors capture most of the systematic drivers behind the strategy’s returns. The coefficient on the momentum factor is positive and highly significant (β = 0.830, p < 0.001), confirming that the strategy is capturing the momentum premium. The strategy’s exposure to the size factor is small and not statistically significant (β = 0.047, p = 0.798), indicating no clear preference for small-cap or large-cap stocks. The loading on HML is negative and borderline significant (β = -0.251, p = 0.078), which is typical of momentum strategies that tend to favour growth over value. The beta on CMA is positive and significant (β = 0.579, p = 0.001), indicating a preference for firms with conservative investment policies. The strategy exhibits a negative loading on the profitability factor (β = -0.421), which is marginally significant (p = 0.059). This might suggest a tilt away from highly profitable firms.
Lastly, the strategy has a highly significant and large positive beta to the market excess return (β = 1.227, p < 0.001), suggesting that it is strongly exposed to broad market movements. This is consistent with the long-only nature of the strategy. The alpha is 0 and statistically significant.
Overall, the regression confirms that the strategy is primarily driven by exposure to momentum and market risk. The high R-squared, combined with strong and significant coefficients on Mkt-RF and MOM, suggest that the strategy’s returns are largely systematic and replicable using known risk premia. The absence of a positive alpha implies that the strategy does not deliver additional returns beyond those explained by its factor exposures.
Risk-weighted long-only momentum
In this section we implement a volatility-targeted version of the long-only momentum strategy, following the approach proposed by Barroso and Santa-Clara (2015).
We apply a volatility-scaling mechanism that adjusts daily portfolio exposure based on recent realized volatility. The procedure works as follows:
- Realized volatility estimation: We compute a 126-day rolling window of the strategy’s squared daily returns, which is then used to calculate the rolling historical volatility. A one-day lag is applied to avoid forward-looking bias.
- Volatility scaling: Each day’s return is rescaled by the ratio of the target daily volatility (derived from an annualized target of 12%) to the estimated realized daily volatility. This adjusts the effective leverage of the portfolio such that its ex-ante volatility remains stable over time.
- Leverage constraint: To prevent excessive scaling during periods of very low volatility, the leverage is capped at 10x, consistent with common practice in the literature to avoid unrealistic exposures.
The result is a volatility-targeted version of the momentum strategy, which adjusts its risk exposure over time while preserving the core signal and rebalancing logic.

Figure 12: 2016-2025 risk weighted returns vs long-only returns

Figure 13: Main statistics risk weighted strategy
Our empirical results suggest that volatility scaling does not improve strategy performance in Emerging Markets. As shown in Table 3, the annualized Sharpe ratio of the risk-weighted strategy (0.23) is significantly lower than that of the unscaled momentum portfolio (0.48). While volatility is effectively reduced from 15.74% to 12.96%, the annual return drops substantially, from 7.55% to just 3.05%, undermining the benefit of reduced volatility.
These findings differ from what Barroso and Santa-Clara report for U.S. equities, and several factors may explain the divergence:
- No Exploitation of Leverage: Although the scaling factor is capped at 10x, we show that this cap was never hit. The average scaling factor remained below 1, meaning the strategy was predominantly scaling down, not up. As a result, the risk-weighted strategy tends to behave like a de-leveraged version of the original strategy, reducing its return potential.
- Past looking signal: Emerging markets often experience sudden volatility spikes linked to macroeconomic shocks, which are frequently followed by strong rebounds. The use of lagged volatility in the scaling process may lead the strategy to scale down exposure at precisely the wrong time, missing out on rebounds.
Idiosyncratic momentum
In addition to the traditional momentum approach based on raw past returns, we implement a residual (idiosyncratic) momentum strategy, following a methodology inspired by Blitz et al., 2011and Barroso & Santa-Clara, 2015. This approach attempts to exploit persistent alpha signals that are orthogonal to broad market risk. The strategy, like the previous ones, is restricted to the set of stocks appearing in the value-weighted benchmark index each calendar year. To ensure data availability and quality, we intersect this set with the tickers that have non-missing prices in that year, resulting in a usable universe for each year.
To estimate idiosyncratic returns, we proceed as follows: Monthly returns are computed from daily prices and aligned to a month-end calendar. Each stock’s excess return over the risk-free rate is regressed, in a rolling window of 24 months, on the market excess return. This represents a simplified single-factor model. The residuals from each regression window are collected, with the last residual of each window stored as the stock’s idiosyncratic return in that month. Stocks with insufficient data or excessive missing values are excluded from the regression to maintain reliability.
The momentum signal is computed using a (12M – 2M) window: for each rebalancing date (every two months), we sum the residuals from months T−12 to T−2, skipping the most recent month to avoid short-term reversal effects. This cumulative residual represents the idiosyncratic momentum score for each stock. Only stocks that are both in the annual index universe and have valid residuals over the estimation window are retained at each signal date. At each rebalancing date stocks are ranked based on their residual momentum signal. The top 5% of the distribution is selected for a long-only portfolio. Portfolio weights are equal across selected stocks. A trading cost of 15 bps is applied at the first trading day post-rebalance.

Figure 14: 2017-2025 Strategy comparison
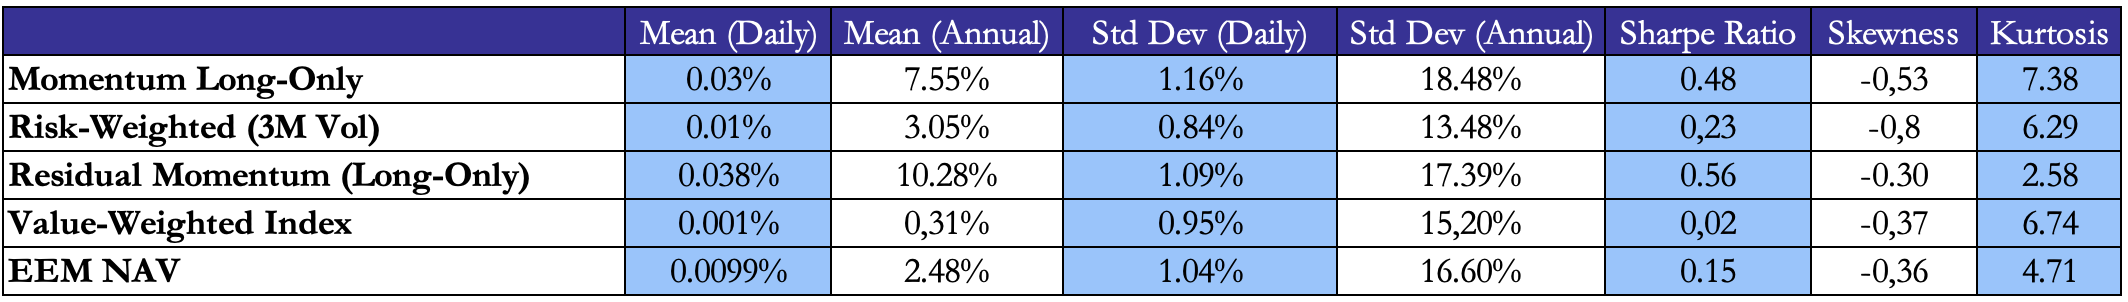
Figure 15: Strategy comparison statistics
On an annualized return basis, residual momentum achieved a 10.28% return, closely tracking the standard momentum long-only strategy (7.55%) and significantly outperforming both the value-weighted index (0.31%) and EEM NAV (2.48%). From a distributional perspective, residual momentum shows lower negative skewness (-0.3) and reduced kurtosis (2.58) compared to standard momentum. This indicates a return distribution that is slightly more symmetric and has thinner tails. The Sharpe ratio is also improved compare to the other strategies, now sitting at 0.56.
The factor regression results show that the strategy’s returns are largely accounted for by exposures to known risk factors, especially market risk (β = 0.93, p = 0.0001), with no evidence of alpha. This suggests that performance is driven by systematic risk premia, which aligns with the strategy’s long only design. At the same time, the strategy maintains clear and meaningful exposure to momentum, reinforcing its tilt toward rewarded market anomalies.
Conclusion
In this paper, we have analysed the performance of various momentum strategies within the Emerging Markets (EM) universe. Our results confirm the widely documented finding that momentum strategies tend to deliver positive and benchmark-beating returns. However, consistent with prior empirical literature, we find limited evidence of true alpha generation once standard risk premia are accounted for.
Specifically, much of the observed performance appears to stem from systematic exposures to known risk factors—namely, market beta, the momentum factor itself, and to a lesser extent, the investment factor. These exposures are particularly relevant given the long-only nature of our strategies, which—by design—lack any offsetting short positions that might help hedge unwanted systematic risks. As such, all three strategies (raw momentum, risk-weighted momentum, and residual momentum) retain significant correlation to the market.
An important limitation lies in the construction of the value-weighted index, which we use as a benchmark for comparison and select stocks to buy and sell in our strategies. Due to data constraints, we compute index weights on an annual basis, applying them to the entire subsequent year. Our approach may misestimate the constituent selection and weight rebalancing.
References
[1] Jegadeesh, Narasimhan, & Titman, Sheridan, “Returns to Buying Winners and Selling Losers: Implications for Stock Market Efficiency”, 1993
[2] Carhart, Mark M., “On Persistence in Mutual Fund Performance”, 1997
[3] Rouwenhorst, K. Geert, “Local Return Factors and Turnover in Emerging Stock Markets”, 1999
[4] Griffin, John M. & Ji, Xiuqing & Martin, J. Spencer, “Momentum Investing and Business Cycle Risk: Evidence from Pole to Pole”, 2003
[5] Fama, Eugene F., and French, Kenneth R., “Production of U.S. Rm-Rf, SMB, and HML in the Fama-French Data Library”, 2023
[6] Barroso, Pedro, & Santa-Clara, Pedro, “Momentum Has Its Moments”, 2015


0 Comments