Executive Summary
Construction materials businesses combine exposure to long-term infrastructure investment with local competitive advantages arising from transport costs and constraints on new quarry development. These characteristics make them potential candidates for leveraged buyouts, although demand remains cyclical.
Such transactions allow investors to combine operating improvements with acquisitions, while differences in regional valuations can influence expansion strategies and exit choices. Their success depends on balancing growth expenditure, borrowing capacity and cash generation.
We use Breedon Group as a case study to examine how these transactions can be structured and where their returns originate. Our hypothetical take-private combines an approximately £2.24bn enterprise valuation with operational improvements and £100m of annual US acquisitions.
We compare a whole-group sale with a US carve-out and separate disposal of the remaining operations. The model generates approximately 22% IRR and 2.7x MOIC under the former and 29% IRR and 3.6x MOIC under the latter. The comparison illustrates how operating performance, financing decisions and exit valuations shape sponsor returns, alongside the risks that could undermine them.
We recommend reviewing the accompanying model for the detailed assumptions and sensitivities.
Outlook of Infrastructure Investment Expectation
It is estimated that around $106tn will be needed globally on infrastructure up to 2040 (McKinsey). That demand comes from two channels. Besides traditional assets such as roads, ports, and airports, there is a new generation of infrastructure that is driving investments up. Among those are fibre optic networks, data centres, and charging stations, commonly referred to as next-generation infrastructure assets.
Diving into more detail, some examples of the capital required by subcategories of infrastructure are energy and power, which will require $23tn of investment until 2040, and data centres (a major driver of demand for energy infrastructure in the form of power grid stability and abundant electricity availability), which are expected to take up $7tn in order to meet the rising demand for compute power until 2030. Energy and the wider digital infrastructure sector together account for about 40% of the estimated investment need through 2040; the $7tn data-centre estimate covers the shorter period to 2030.
Another report on investment in infrastructure highlighted that cumulative global infrastructure investment over 2025–2050 could reach $151tn (PwC and Oxford Economics). On an annual basis, spending is expected to rise from $4.4tn in 2024 to $6.9tn in 2050.
The attractiveness of the sector is also illustrated by the growing flow of institutional capital in specialised infrastructure investment funds. 2025 was a record year for the industry, seeing fundraising of nearly $200bn, which beat the 2022 peak of $180bn. As a result, infrastructure is outpacing other private market categories, with raised funds growing at a CAGR of 9% for the period between 2020 and 2025, compared with declines of 3-5% in other asset classes. Among approximately 300 surveyed LPs in McKinsey’s study, the most cited reasons for the appetite in infrastructure funds were diversification, improved returns, and performance, each given by respectively 68%, 52%, and 48% of those surveyed. The second most cited reason, improved returns, was up by 11 percentage points compared to the previous year. It represents an interest in understanding why exactly these elevated returns are expected at the current moment.
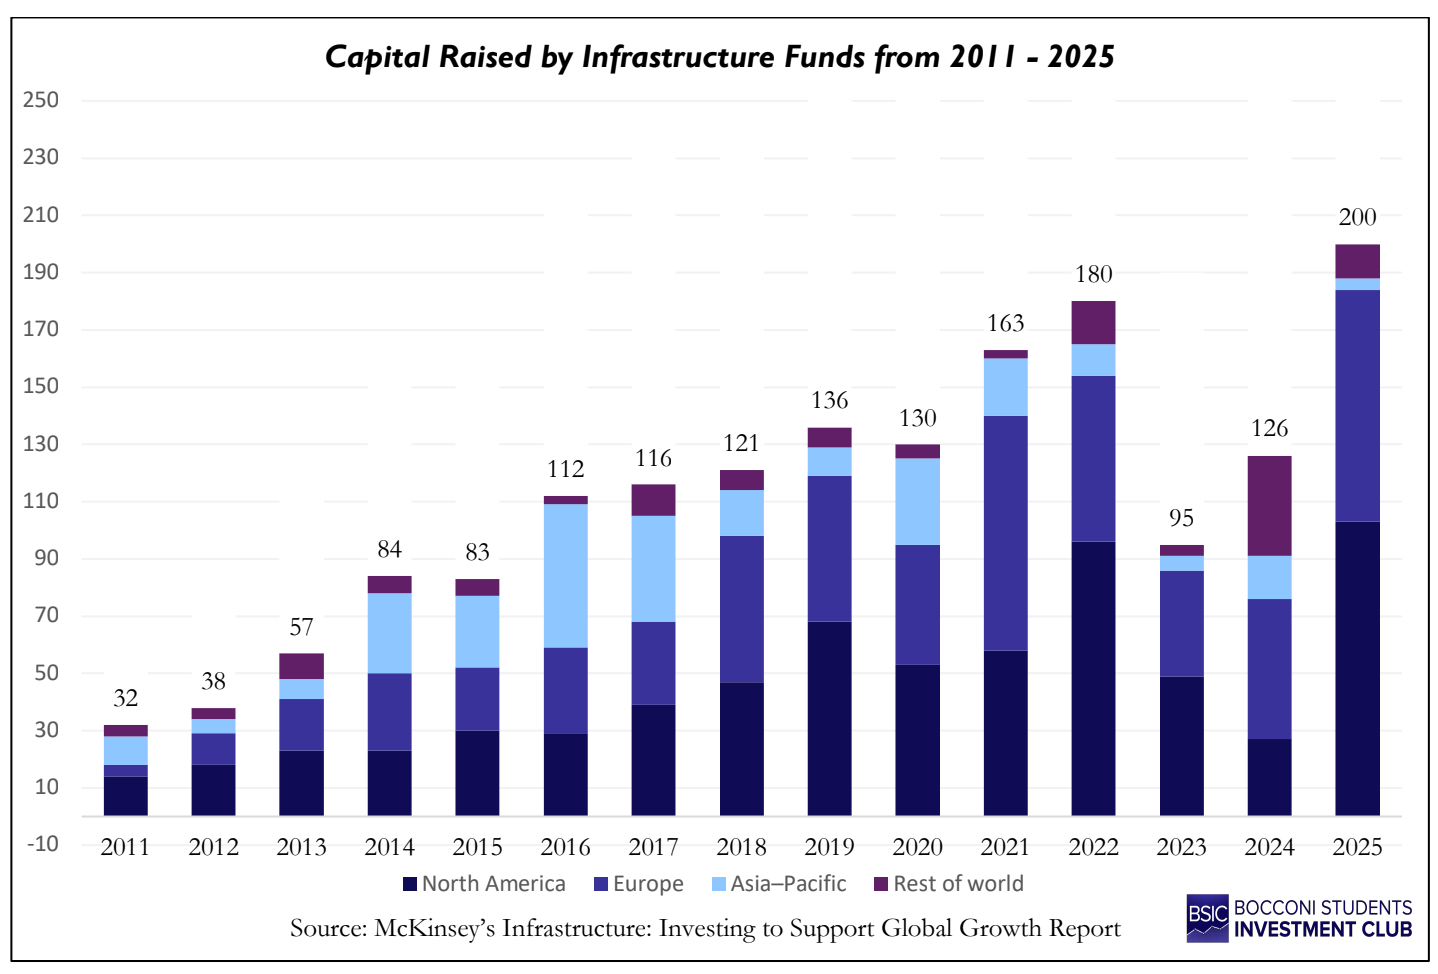
Why are Investors Expecting Elevated Returns?
One reason is the shift towards higher-risk strategies with higher target returns. LPs are willing to provide allocations to riskier strategies. This is illustrated by the shift of allocations from core to core plus and value-add investment approaches, with fundraising for the two categories being up, respectively, 390% and 30% in 2025, compared to 2024. A second factor is the effect of higher interest rates on entry valuations. A report by Macquarie found a statistically significant negative relationship between interest rates and EV/EBITDA trading multiples for infrastructure assets. InfraRed’s Strategic Outlook 2025 estimated a roughly 10% net entry IRR over ten years for core infrastructure. This is an estimate rather than a guaranteed outcome. Higher interest rates also increase debt-service costs, so lower entry multiples do not automatically translate into higher leveraged equity returns. The third reason is the increasing demand for infrastructure assets coming from the population’s growing electrification needs, as well as the demand for compute power, stemming from the development of AI, especially for digital infrastructure.
Government Infrastructure Spending Programmes in the UK, USA, and Ireland
Investment in infrastructure is also supported by broad government initiatives in the nations outlined above. Beginning with the UK, two programmes are in place, accounting for significant public expenditures in the sector. The 10-year infrastructure plan, announced mid-year 2025, envisions at least £725 bn of spending, with the main focus being economic and social projects. Specific allocations include £39bn for the Social and Affordable Homes Programme. The National Infrastructure and Service Transformation Authority (NISTA) published an initial pipeline in July 2025 covering about £530bn of planned public and private investment over the following decade. Spending in the sector is further supported by RIS3, a government programme to renovate and maintain England’s strategic road network of motorways and major A-roads. Albeit smaller in size, it commits over £27bn from April 2026 to March 2031. According to a report compiled by the Office for National Statistics, market-sector infrastructure investment in 2025 was £31.3bn in 2023 chained volume measures, up 12.1% year on year. General government investment was £30.8bn in current prices, down 0.7%. The two series use different price bases.
Ireland announced a review of its National Development Plan (NDP), concerning investments in infrastructure, also in the middle of 2025, which provides for €275.4bn of investment over 2026–2035. The core ambition of the plan is affordable housing, with the Department of Housing getting an allocation of €35.9bn to spend between 2026 and 2030. Furthermore, €24.3bn has been allocated for transport over 2026–2030.
As for the United States, the Infrastructure Investment and Jobs Act (IIJA), enacted in 2021, provided $1.2 tn of investment, of which $550 bn was new money. $110bn was allocated to roads and bridges, $73bn for power and grid investment, and $66 bn for rail. Disbursement and construction take place over several years. The original surface-transport authorisations ran through September 2026, with subsequent funding dependent on extensions and reauthorisation. The proposed $580bn BUILD America 250 Act concerns five years of surface-transport funding; it should be distinguished from an enacted replacement for the whole IIJA.
What Are Aggregates, How Are They Used, and Why Are They an Attractive Investment (UK, USA, Ireland Focus)?
Aggregates are basic construction materials such as sand, gravel, and crushed rock. They are extracted from sites called quarries. Aggregates have a low value per tonne relative to their weight, so transportation is a major component of delivered cost. This means that most of the demand for them is satisfied locally, mirroring infrastructure asset characteristics. Haulage can significantly increase the delivered price over relatively short distances. A nearby quarry can therefore have a substantial cost advantage, subject to product quality, transport mode and local pricing. A report by the MPA (Mineral Products Association in the UK) highlights that 80% of mineral products are used within a 30-mile radius. As for the US, an industry publication has outlined that delivered aggregate prices essentially double within 23 to 45 miles from a quarry; 90% of all aggregates in the states are consumed within a 50-mile radius. What makes the pricing power of aggregate producers even stronger is the length of the time periods required for obtaining permissions for mineral extraction. Another publication by the MPA (Mineral Products Association UK) highlighted that, based on the period between 2012–2021, it took an average of almost 32 months to obtain permission for new sand and gravel reserves, and more than 29 months for crushed rock. Most applications concerned extensions to existing quarries. This period doesn’t factor in the time it takes to locate the site in the first place. Over the decade covered by the MPA’s 2026 report for Great Britain, just 49 tonnes of new sand and gravel reserves have been permitted for every 100 tonnes extracted. The situation for crushed rock is even more alarming, with 32 tonnes of reserves being permitted for every 100 tonnes extracted. The story is similar in Ireland, although to a smaller extent, with the replenishment rate as of the summer of 2025 sitting at 61%.
The following charts compare UK construction-material prices and US aggregate prices with consumer price inflation. They provide context for pricing resilience, although the UK series covers construction materials more broadly.
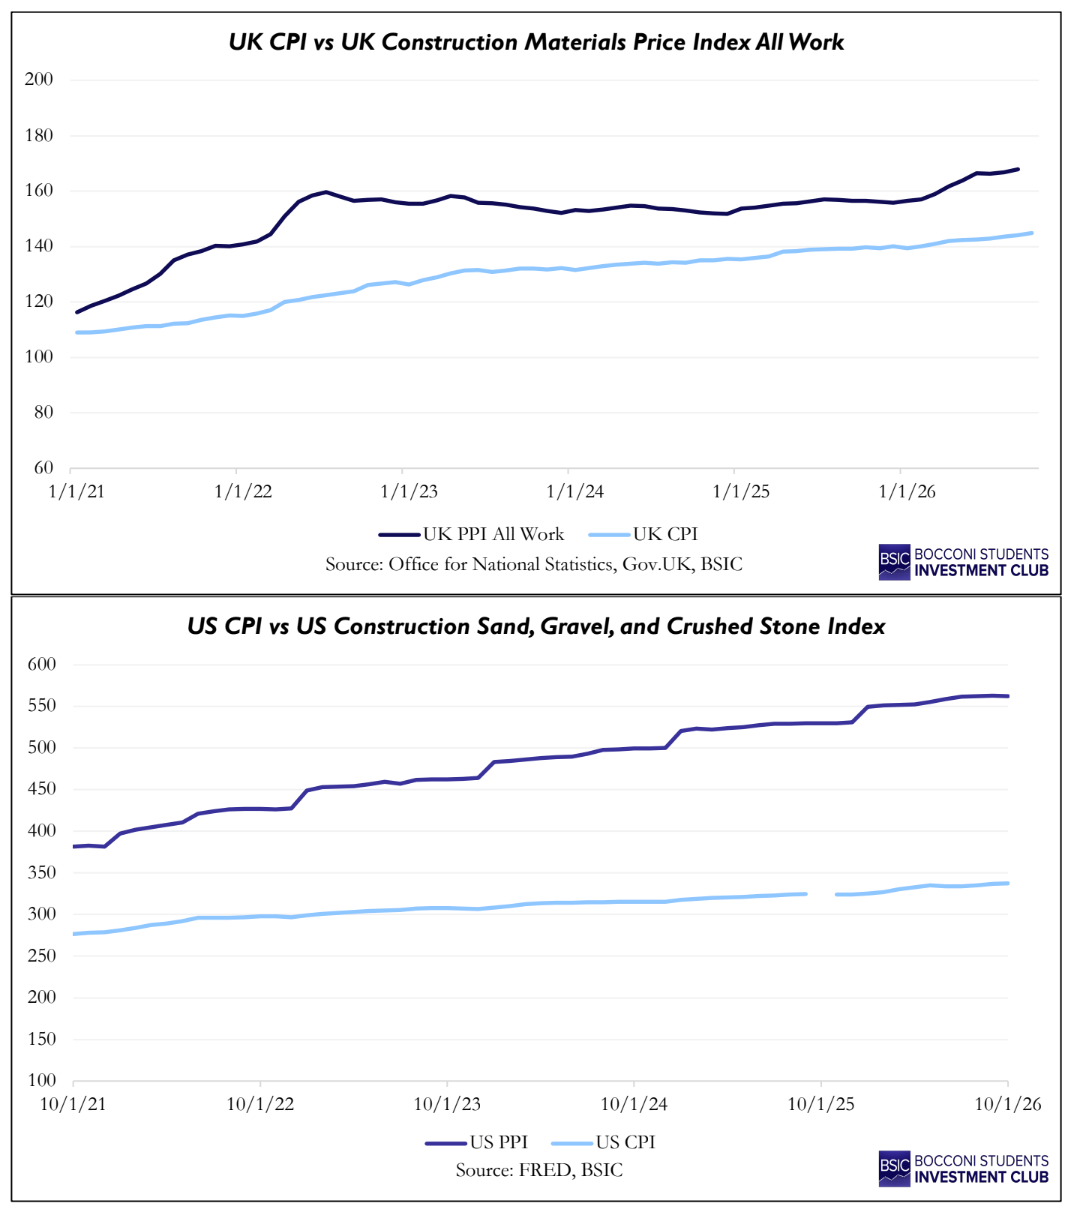
Furthermore, aggregates are essential to many types of infrastructure development. Although aggregates are not the primary expense in each project, their range of uses creates diversified demand for sand, gravel and crushed rock. Volumes nevertheless remain cyclical. Examples include the transportation subcategory, including roads, airports, railways, and ports. Aggregates typically make up around 93–97% of hot-mix asphalt by weight; this is a pavement composition figure rather than the share of all materials in an entire highway. To put the magnitude of such a project into context, NSSGA estimates that a mile of four-lane highway uses approximately 38,000 US tons of aggregates, while SNCF reports that railway ballast requirements range from about 2 tonnes per metre of line to as much as 5 tonnes for high-speed lines.
Considering power and energy, aggregates primarily play a role in the creation of access roads and foundations. In the case of wind turbines, their use is considerably more significant, because concrete foundations require substantial aggregate volumes, which vary with turbine size and foundation design. As for digital infrastructure, Martin Marietta, a US building-materials producer, cited a $1bn Google data-centre project in Kansas City requiring nearly 800,000 US tons of aggregates in its first-quarter 2024 earnings call. This is a project example rather than a standard requirement for all data centres.
Moving downstream into Cement, Ready-Mix Concrete and Asphalt
Cement is a key ingredient going into the production of concrete. It is produced by heating a prepared mix, typically including limestone and clay, to form clinker, which is ground with gypsum and other constituents. Cement is then mixed with water, sand and coarse aggregates to produce concrete. Fresh concrete has a limited working time, and thus plants producing its ready-mixed version are relatively small-scale and provide their services in a small radius. Such plants can be set up relatively quickly and cheaply; however, the delivery of their inputs is a key part of their operations, as established previously.
Note on CBAM (Carbon Border Adjustment Mechanism) and its effect on UK-based producers
Beginning 1 January 2027, the UK introduces a carbon charge on imports of specified cement products. The liability depends on embodied emissions, the applicable sectoral carbon rate and relief for qualifying carbon prices paid overseas. Rates will be set quarterly with reference to UK ETS costs, adjusted for free allocation. The UK–EU ETS linking agreement announced on 20 November 2026 creates conditions for CBAM exemptions, but the treatment at a given date depends on implementation. Domestic producers also face changing UK ETS costs as free allocation is phased out. Preservation of their margins will depend on emissions intensity, energy costs, import competition and how much of the additional cost can be passed to customers. Effective measurement of overseas emissions and administration of the charge will therefore matter for competitive outcomes.
The forecast captures energy, fuels and carbon within its operating-cost assumptions. It does not separately model a CBAM benefit or a plant-level UK ETS sensitivity.
Consequently, the investment case does not rely on a quantified uplift from carbon-border protection. Actual outcomes will depend on Breedon’s emissions intensity, import exposure and ability to pass through carbon costs; these remain risks to the forecast.
Why is the Current Moment a Favourable Entry Point into the Industry, and why into Breedon?
The investment outlook, constraints on new quarry supply, government spending programmes and institutional capital inflows support an interest in construction materials. For Breedon, the opportunity combines established UK and Irish operations with a growing US platform. The valuation gap between UK and US equity markets provides context for considering a UK-based acquisition, as the forward P/E comparison below illustrates. Index-level valuation gaps do not establish Breedon’s fair value, however, and the modelled 35% offer premium must be justified by achievable operating improvements and cash generation.
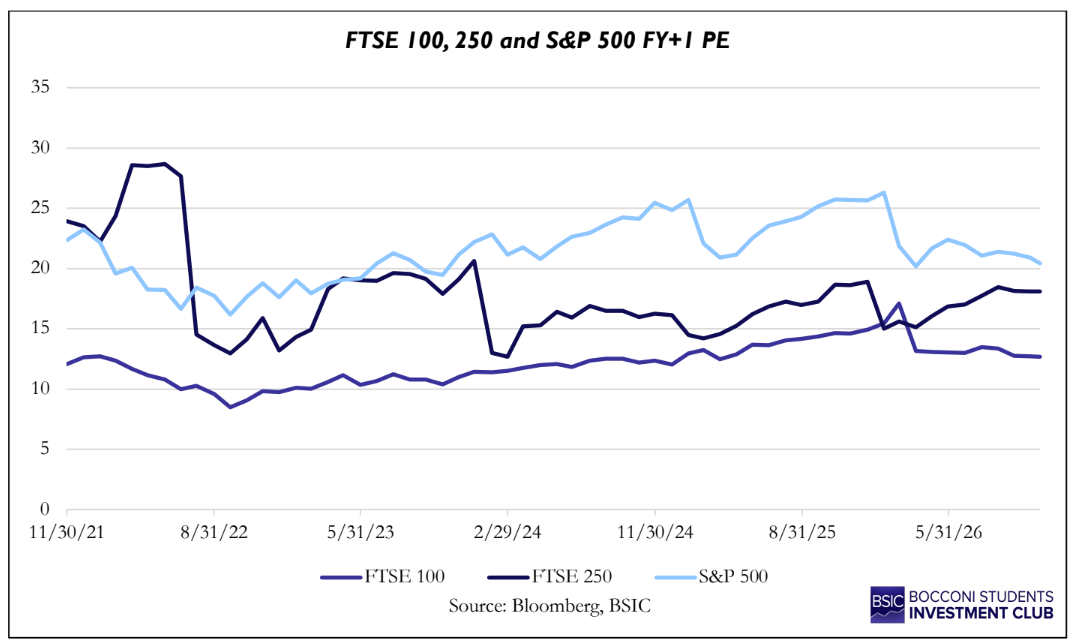
Breedon’s vertically integrated model provides access to quarry reserves and downstream routes to market. Private ownership could support targeted pricing, cost and portfolio improvements, particularly within the US operations, alongside selective acquisitions. These company-specific opportunities form the basis of the value creation plan below.
Why Breedon is a Compelling Target
Breedon is an appealing take-private candidate because it has a well-established vertically integrated construction materials business that also has a quantifiable path to improving profitability. Breedon operates in asphalt, cement, aggregates and downstream contracting. Furthermore, the company operates in the United States, Great Britain and Ireland, allowing it to operate in various construction markets. Additionally, given the high transportation costs for aggregates and the presence of local quarry infrastructure, Breedon benefits from structural advantages that are difficult for other companies to replicate.
Similar to Starboard Value’s strategy regarding Knife River (another integrated construction materials company that includes both aggregates and contracting), the value creation strategy will focus on not just allowing the company to benefit from market recovery, but also to quantify where the profitability gap exists and then close that gap through pricing optimisation, cost and overhead efficiency, and portfolio optimisation.
In FY2025, Breedon’s underlying operating margin was 9.7%. Additionally, Breedon’s underlying EBITDA margin of 16.3% compares with medians of 20.0% and 23.0% for the model’s selected US and European peer groups, respectively. These broad peer groups provide reference points rather than directly comparable margin targets. Based on these metrics, specifically the underlying operating margins in the United States (7.5%) and Great Britain (9.3%), compared with Ireland (17.8%), it may be more beneficial to implement a focused, segmented strategy instead of attempting to create a uniform margin goal for the entire company.
Finally, because Breedon has completed several acquisitions, such as Hope Construction Materials, Lagan and selected CEMEX UK assets, and entered the United States through BMC in 2024 before adding Lionmark in 2025, the company has experience integrating businesses, although future acquisitions still carry execution risk. Specifically, within the United States, there is the potential to pursue bolt-on acquisitions and to potentially increase both the strategic and financial buyers looking to purchase the company in an exit strategy.
Overall, the investment case is to purchase a well-established integrated construction materials company, focus on closing the profitability gap through quantifiable optimisations, and selectively grow the company within the United States while remaining focused on financial performance.
Value Creation Plan
Pricing optimisation. One potential value creation strategy will be to optimise realised prices for construction materials (including aggregates) through more disciplined contract pricing and leveraging local market competitive positioning. Like with Starboard’s strategy, Breedon’s realised prices should be benchmarked against similar competitors after adjusting for geography, product mix and freight treatment. Using the model’s combined FY2025 divisional aggregate volume of around 28.1 million tonnes as an illustrative base, raising the price by £1 per tonne with a 50% flow-through impact on EBITDA would result in around £14.1 million of annual EBITDA gained. This is an illustrative sensitivity, not an additional uplift layered on top of the model’s existing price-growth assumptions. It must allow for internal sales, potential volume losses and changes in input costs.
Cost and overhead efficiency. A second value creation strategy will be to conduct a bottom-up analysis of costs, logistics, overhead and more. Based on Breedon’s total revenue of £1.71 billion for FY2025, reducing recurring costs by 100 basis points of revenue would result in around £17.1 million of annual EBITDA gained (this does not account for any lost revenue or costs that may offset this gain). This is an illustrative opportunity rather than a discrete saving added separately to the current forecast. Any incremental saving should be attributed to specific initiatives and checked against efficiencies already implicit in the cost build.
Business-mix optimisation. Breedon’s downstream contracting and surfacing operations strengthen demand for internally produced materials, but individual activities may differ substantially in profitability and capital intensity. The strategy should therefore focus on reducing exposure to structurally low-return contracts and allocating resources towards higher-margin materials production, while retaining downstream operations that support the group’s integrated business model.
US buy-and-build strategy. Breedon’s existing US operations provide a platform for acquiring complementary regional materials businesses. The current model assumes £100 million of annual acquisition expenditure over 2027–2031, funded through acquisition-facility drawings, at an average enterprise-value-to-EBITDA multiple of 8.1x. At that valuation, each £100 million invested would add approximately £12.3 million of annual EBITDA before synergies, assuming the acquisition delivers the earnings implied by its purchase multiple. Additional value, beyond the acquired EBITDA explicitly modelled, may be generated through procurement synergies, operational integration and improved route density. The investment case should not, however, depend on achieving a higher exit multiple without justification.
Cash generation and deleveraging. Breedon generated £133.2 million of company-defined free cash flow before major capital investment projects in FY2025, providing evidence of its ability to convert operating profits into cash. Following the acquisition, operating cash generation supports debt service, distributions and selective US expansion. The model directs 50% of positive levered free cash flow to sponsor dividends and uses the remaining cash, after minimum liquidity requirements, for discretionary debt repayment. The £100 million of annual acquisitions is financed separately through facility drawings. Capital allocation should prioritise required maintenance expenditure and debt-service obligations before additional acquisitions. Debt/EBITDA declines as earnings grow, but nominal debt increases because acquisition drawings exceed repayments. This distinction matters when assessing financial risk and the sources of equity returns.
Collectively, these initiatives provide a route towards higher margins by 2031, subject to execution. The model forecasts group EBITDA rising from £266.6m in 2026 to £524.9m in 2031, with the EBITDA margin increasing from 15.3% to 20.4%. Acquired EBITDA contributes £61.7m of the increase; the remaining improvement comes from the existing business. The pricing and cost sensitivities above illustrate potential initiatives and are not added separately to the forecast.
UK Takeover Code – Deal Structure
If you want to buy a UK-listed company, the procedures outlined in the Takeover Code must be followed. The three of them outlined below are the most important ones to be considered. These and the order in which they come into play are as follows. First, how long a bidder has to reach a definitive decision regarding their takeover intentions; then the certainty of the funds to complete the deal; and lastly, how shareholders approve the deal.
Focusing on the timing, the countdown for a presented offer by a bidder begins when they are first identified in a possible-offer announcement. From that moment, the acquirer has until 5 pm on the 28th day to either put up a firm offer or give up on the transaction and walk away. There is a possibility for extension of this timeline, given that talks are going well, the target’s board can ask the Takeover Panel for more time, subject to the Panel’s consent. In the case that the bidder walks away, they are normally blocked from bidding for that company in the upcoming six months. Putting up is just as serious, since a bidder can only announce a firm offer when it has every reason to believe it can complete it. For a cash offer, its financial adviser has to confirm publicly that the money is there to pay every shareholder in full. The Takeover Code generally prohibits financing conditions, subject to limited exceptions. Acquisition financing must therefore meet the applicable certainty-of-funds requirements before the firm-offer announcement.
For the proposed scheme of arrangement, the scheme document must normally be published within 28 days of the firm-offer announcement, unless the Panel consents otherwise. At the court meeting, a majority in number of eligible scheme shareholders present and voting, representing at least 75% in value of those voting in each relevant class, must approve the scheme. Related special resolutions must also pass. The court then has to sanction it, and once that order is filed, every shareholder is bound, including the ones who voted no.
Breedon Group LBO Offer Price, Premium, and Sources & Uses
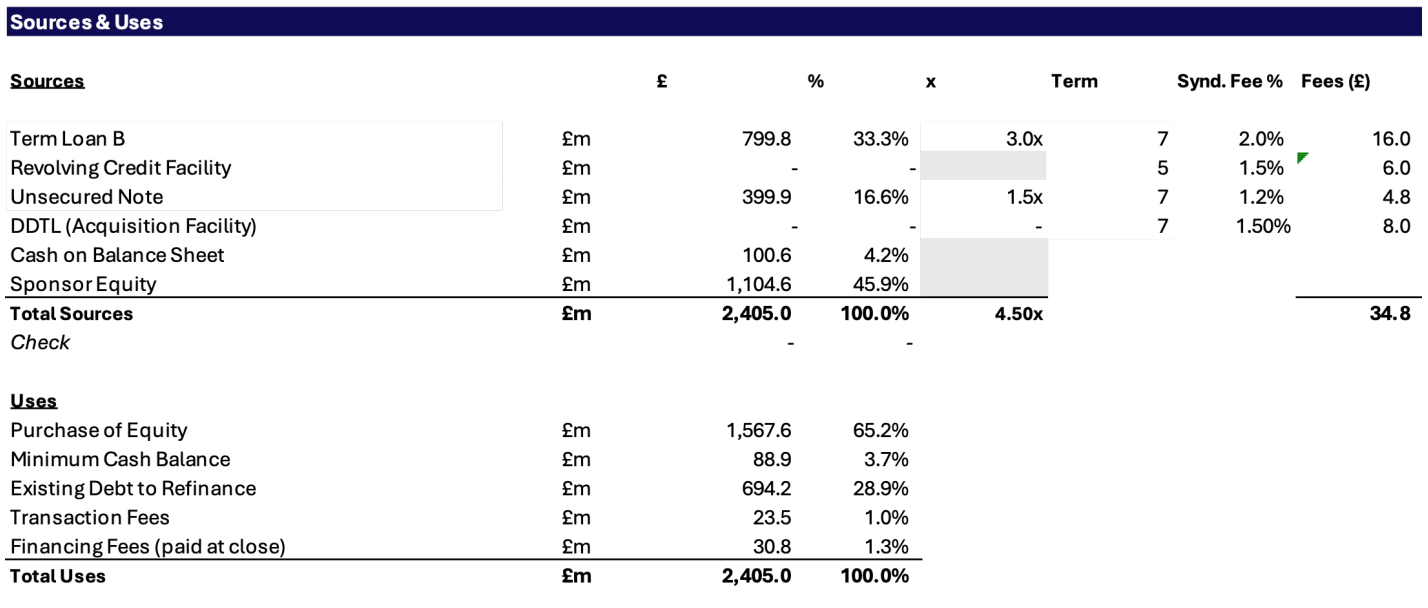
Using an undisturbed share price of £3.30, with a 35% premium, our model produces an offer of £4.455 per share. After accounting for outstanding options and restricted stock units (RSUs), we arrive at a fully diluted equity consideration of approximately £1.57bn.
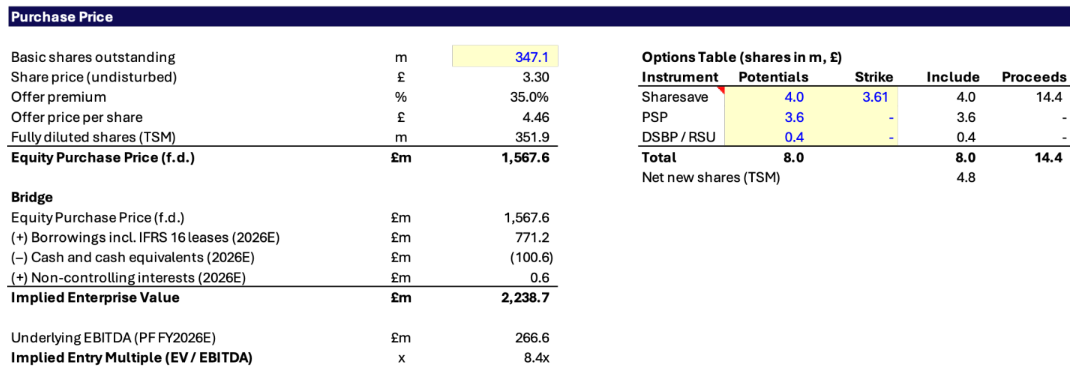
Adding existing borrowings and non-controlling interests, then deducting cash, produces approximately £2.24bn enterprise value. Against £266.6m forecast 2026 EBITDA, the implied acquisition multiple is 8.40x, close to the 8.43x median for the model’s selected European peer group.
Total funding requirements are approximately £2.405bn, including refinancing, minimum operating cash and transaction and financing fees. Funding comprises approximately £799.8m of TLB debt, £399.9m of unsecured notes, £100.6m of existing cash and £1,104.6m of sponsor equity. The RCF and DDTL are undrawn at closing.
Explanations behind the Formulation of the Debt Structure of the Deal
Repayment assumption: repay the RCF first, then split remaining discretionary cash equally between the TLB and DDTL. The senior facilities are assumed to rank pari passu, ahead of the unsecured note. This cash-allocation convention is separate from contractual seniority.
Senior leverage:
The target senior leverage for the buyout of Breedon is set at 3.0x PF 2026E EBITDA, or approximately £799.8m on the model’s £266.6m EBITDA forecast. This value was derived by first considering illustrative senior leverage ranges for LBOs of 2x – 3x EBITDA, as specified by resources published by Wall Street Prep. For further reference, consider Macquarie Infrastructure’s buyout of Renewi (Financing Arrangements, Implied EBITDA) and Apollo’s buyout of US Silica (Financing Structure, Management’s Adjusted 2024 EBITDA Forecast). The transactions occurred in 2025 and 2024, respectively. The model’s indicative financing comparison for Renewi, a recycling and waste-management business, produces a senior leverage ratio of approximately 3.05x, with both the term facility and EBITDA measured in euros. That of US Silica (producing frac sand used in O&G, as well as silica, which is a mineral used in the production of glass and other materials) was completed with a senior leverage multiple of 3.18x. These deals are chosen as these assets most closely resemble the infrastructure characteristics observed in Breedon, which are discussed above. These comparisons depend on the debt perimeter and EBITDA definition and are reference points rather than direct measures of Breedon’s debt capacity. We assume 3.0x senior leverage in view of building-materials cyclicality, maintenance capital expenditure and debt-service requirements. It is a modelling assumption rather than a lender commitment.
For the instrument to be used as secured financing, we opt for a Term Loan B. Such a facility was used in the US Silica buyout as well as the deal between Quikrete and Summit Materials (to be discussed later). The model assumes bullet repayment with no mandatory annual principal amortisation, while allowing discretionary repayments. The maturity of the debt is assumed to be 7 years, as observed in the other deals.
Breedon operates across the United States, Ireland, and the UK. This means that the company collects revenues in USD, EUR, and GBP. Borrowing in currencies aligned with operating cash flows could reduce currency mismatches, subject to financing costs and hedging arrangements. For simplicity, the loan will be syndicated entirely in GBP, as Great Britain generates the largest share of divisional EBITDA. This leaves currency exposure to be considered in the risk analysis.
Now moving over to the spreads over the base rates. In Q2 2026, the average spread on euro-denominated single-B TLBs tightened to 335bps over the benchmark, according to data provided by Carlsquare. Based on a report provided by PitchBook in August, the spreads over Euribor were E+350 for B2-rated borrowers, and E+378 for single B-rated ones. These market observations provide context, but they do not establish a post-buyout credit rating for Breedon or an equivalent spread for GBP debt. That said, for our TLB we will take the 350 bps margin as a base, and add a discretionary 50 bps allowance for GBP market conditions and transaction-specific execution risk. Our margin is calculated on the basis of SONIA + 400bps. The base case uses that margin; no separate spread-sensitivity analysis is presented. The model assumes an upfront financing fee of 2% of the TLB amount. The spread and fee are modelling assumptions rather than quoted financing terms. The £400m RCF has a five-year term and is undrawn at closing and carries assumed pricing of SONIA+350bps, a 1.5% upfront fee and a 1.225% annual commitment fee on undrawn capacity.
Total Leverage:
The targeted total leverage for the buyout is set at 4.5x PF 2026E EBITDA, or approximately £1,199.7m of drawn acquisition debt. This excludes carried IFRS 16 lease liabilities and the undrawn RCF and DDTL commitments. As a financing reference point, we referenced Quikrete’s acquisition of Summit Materials, which closed in February of 2025. Quikrete is a large-cap, privately owned materials business in the US, which expanded its positioning by taking Summit Materials private, as part of the company’s roll-up strategy. Summit was valued at an EV of $11.5bn. The total leverage for the deal (DEBT/EBITDA) is estimated to be around 5.0x by credit agencies. We use 4.5x as the closing leverage assumption, subject to Breedon’s cash-flow capacity and the different EBITDA and debt definitions used in transaction comparisons. (IFR Deal Leverage, PitchBook Financing Structure, Latham & Watkins’s commentary on rates of debt). The remaining 1.5x EBITDA, approximately £399.9m, is financed with a seven-year bullet high-yield unsecured note. Its denomination is to be in GBP, and to arrive at its coupon, we reference the OAS (Option-adjusted spread) on the MSCI GBP HY Corporate Bond index, as a broad pricing reference. A working credit-spread assumption of around 550bps and an illustrative seven-year gilt yield near 5% provide an approximate pricing cross-check; an index OAS does not directly determine a new bond’s coupon. We assume a fixed 10% coupon in the model. The note is unsecured and would rank behind secured creditors in access to pledged collateral. The upfront financing fee on the high-yield note is assumed to be 1.2%.
DDTL:
A DDTL represents a delayed draw term loan: committed funding that may be drawn during an agreed availability period for purposes such as acquisitions or capital expenditure. Unlike an RCF, amounts repaid cannot generally be redrawn. The model uses one acquisition facility with capacity of $700m, translated to £533.6m at £0.7623 per dollar, and assumes seven-year availability and maturity. This is a modelling assumption rather than an assertion that seven-year availability is standard market practice. The facility is undrawn at closing and supports £100m of annual acquisitions over 2027–2031. Drawn balances bear SOFR+475bps; the model presents debt balances and cash flows in sterling at a constant exchange rate. The annual commitment fee is 0.5% on undrawn capacity, with no fee-free quarter modelled. The total arrangement fee is assumed to be 1.5% of committed capacity. Half of the fee, approximately £4.0m, is paid at closing, with the remaining £4.0m payable at expiry. Repaid amounts do not replenish the modelled availability.
Published credit agreements, including ATI’s June 2025 agreement, illustrate how delayed-draw commitments can be documented. Their terms are transaction-specific and provide context rather than contractual terms for this hypothetical financing.
Returns Analysis & Path to Liquidity
We explore two primary exit options. The first is a sale of the whole Breedon Group, with the model assuming a full sponsor exit. The other path to liquidity is a sum-of-the-parts sale, in which we carve out the US portion of the group. Before we discuss the differences between the two paths, a few generally applicable statements can be made.
Firstly, the key driver of returns is EBITDA growth. Even in the face of no multiple expansion, returns are lifted up by small US businesses whose earnings can be acquired at comparatively low multiples. (We assume an 8.1x EV/EBITDA multiple on the US acquired businesses, in line with precedents). Funding the expansion with debt increases borrowing and interest expense; under the model’s assumptions, acquired earnings nevertheless contribute to value creation.
To further emphasise the importance of the EBITDA growth we forecast: even though we draw financial debt, increasing from £1.20bn to £1.61bn over the hold period, leverage relative to EBITDA declines; debt/EBITDA falls from 4.5x to c.3.1x. (This ratio excludes carried lease liabilities). This supports our US expansion case, subject to delivering the forecast earnings growth and maintaining sufficient liquidity.
An additional driver of returns is the assumed distribution of 50% of positive levered free cash flow as sponsor dividends, which brings forward cash distributions. This is a model assumption rather than an established TLB covenant. The IRR calculations recognise each dividend in the year it is paid.
Now, as promised, we analyse the two considered exit scenarios.
Whole-Group Strategic Sale
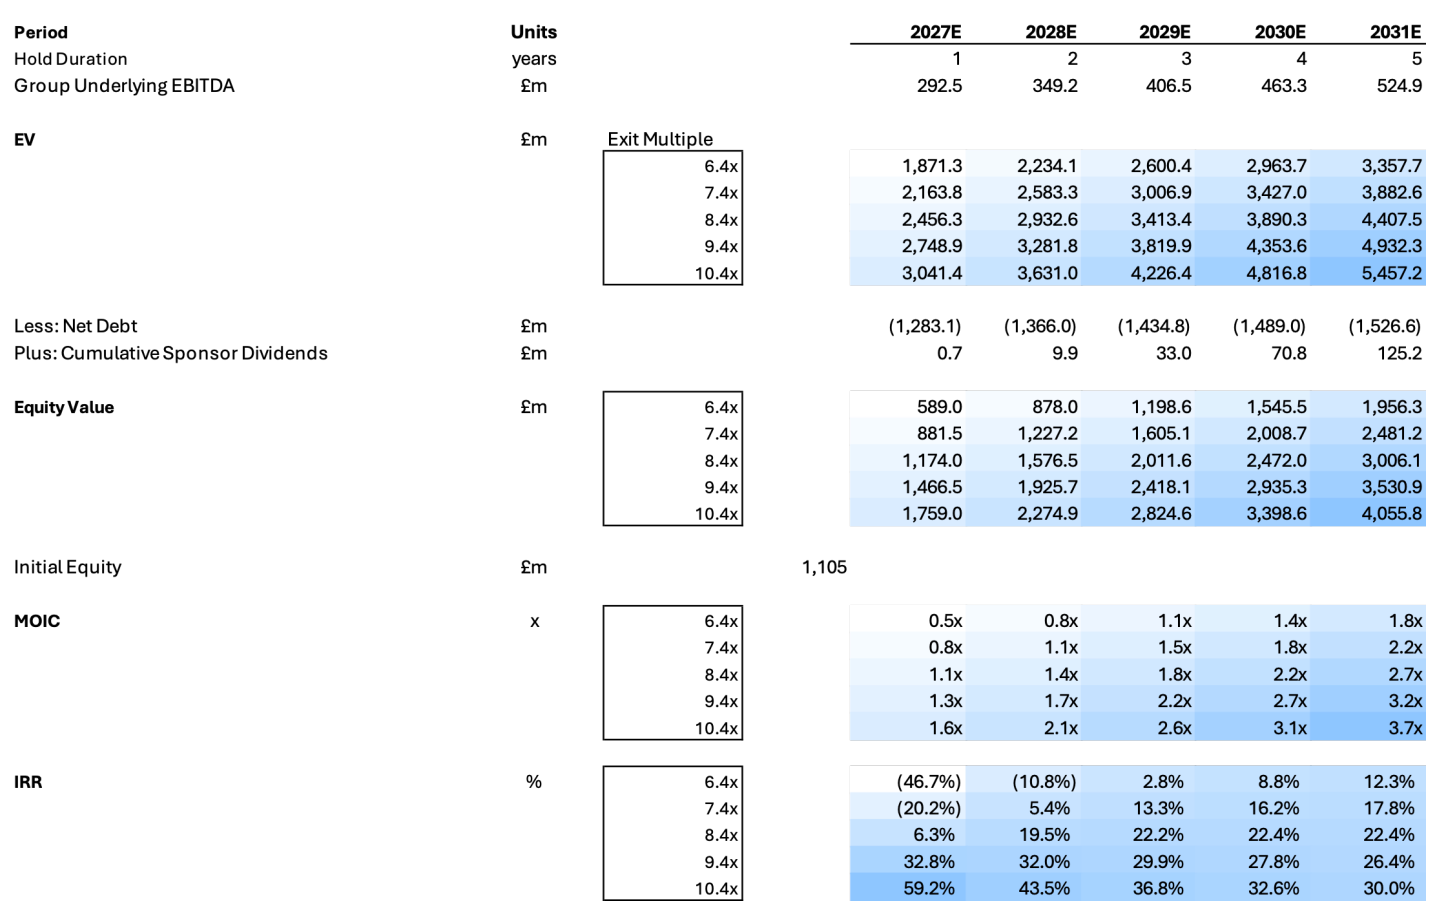
A strategic buyer could value Breedon’s established quarry positions, integrated operations and opportunities to combine procurement, logistics and overhead. For instance, CRH or Heidelberg Materials are illustrative potential buyers based on their existing building-materials operations across relevant markets. Any transaction would depend on strategic interest and competition clearance. The central five-year case assumes an exit at the unchanged entry multiple of 8.40x, generating approximately 22.4% IRR and 2.72x MOIC. Returns under that scenario can be seen below.
US Carve-Out and Separate Disposal of the Remaining Group
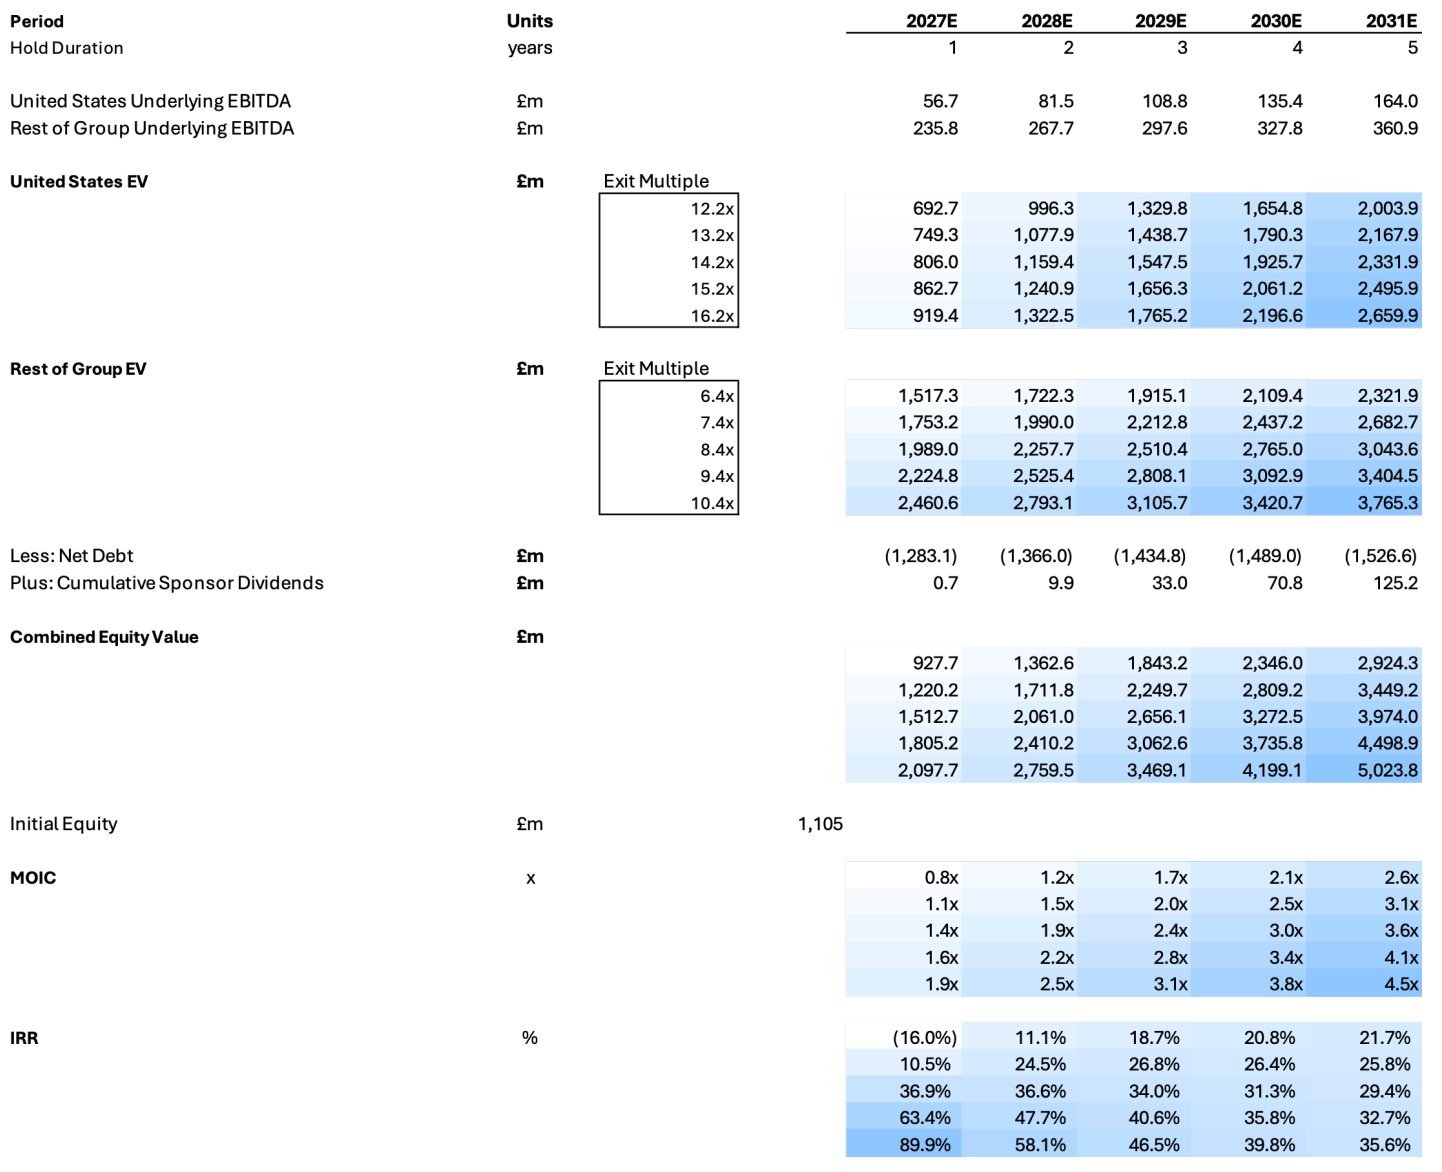
By 2031, modelled US EBITDA reaches approximately £164m, including the earnings generated by the annual £100m acquisition spend; remaining-group EBITDA is approximately £361m. Applying the model’s selected median US multiple of 14.22x EV/EBITDA to the US business and the selected European peer-group median of 8.43x to the remaining group produces a combined enterprise value of approximately £5.38bn. This compares with approximately £4.41bn for the whole-group central case: around £968m of additional enterprise value from the different valuation assumptions.
This result supports the thesis of using the UK and Irish businesses’ cash generation and the group’s financing capacity to support US expansion. The resulting five-year return is approximately 29.4% IRR and 3.60x MOIC. Separation costs, tax leakage, standalone overhead and the allocation of central costs could reduce proceeds. The model does not separately deduct these carve-out costs, so the comparison is before those costs.
Key Risks
One key risk concerns the previously discussed demand drivers. Namely, public spending announcements may translate into projects slowly. Moreover, private construction remains exposed to economic activity and financing costs, particularly in an environment of rising energy costs.
Another is margin delivery; our forecast requires substantial US improvement. Product mix, local competition, or cost inflation could prevent convergence towards assumed margins. This goes as much for the existing US operations, as for the acquired businesses. On that note: acquiring £100m annually at 8.1x EBITDA requires availability of suitable targets. Competition, particularly in light of the private capital influx described above, integration costs or weaker acquired earnings could reduce returns.
Another potential risk is liquidity. In 2027, only £1.5m of levered free cash flow is generated. Although EBITDA is positive, the minimum cash requirement rises and the model draws approximately £8.4m on the RCF. The model also distributes approximately £0.7m of dividends that year. Early cash-flow headroom is therefore limited, and a weaker outcome could require distributions or acquisition spending to be reduced.
In a similar vein, interest expense on the floating-rate RCF, TLB and DDTL is sensitive to a volatile interest rate environment. The USD-denominated DDTL also creates foreign-exchange exposure, although US operating cash flows provide a partial natural offset. The model holds the exchange rate constant and does not separately model a hedge.
Conclusion
Breedon illustrates how an infrastructure-linked materials business can provide a platform for a leveraged buy-and-build strategy. Established quarry positions and integrated operations support the investment case, while operational improvements and US acquisitions provide potential sources of earnings growth.
The model demonstrates how these decisions interact: EBITDA growth reduces leverage relative to earnings even as acquisition funding increases absolute debt. Comparing a whole-group sale with a US carve-out also shows how regional valuation assumptions can materially affect sponsor returns, subject to separation costs and execution.
More broadly, the case highlights the importance of distinguishing market tailwinds from achievable company-level improvements. Assessing similar transactions requires disciplined acquisition pricing, credible margin assumptions and sufficient cash-flow headroom, alongside an exit strategy whose valuation reflects the business ultimately being sold.
References
[1] McKinsey & Company, “Infrastructure: Investing to support global growth”, 23 March 2026
[2] PwC and Oxford Economics, “Global Infrastructure Outlook 2025–50: Investing in infrastructure, the platform for accelerating human progress”, 28 April 2026
[3] Macquarie Asset Management, “Private Infrastructure Valuations”, January 2026
[4] Greeman, Adrian, Aggregates Business, “Large players dominate UK industry”, 3 April 2012
[5] Mineral Products Association, “Transport Efficiency”, n.d.
[6] Construction Briefing, “Report: US aggregates sector supports $171bn in economic activity”, 2025
[7] Mineral Products Association, “Decade of under-replenishment risks aggregates supply squeeze”, 24 April 2023
[8] Mineral Products Association, “Secure future growth through minerals planning”, 1 September 2026
[9] RTÉ News, “Concrete industry warns of quarry materials shortfall”, 25 June 2025
[10] HM Revenue & Customs, “Carbon Border Adjustment Mechanism: policy summary”, updated 2 November 2026
[11] HM Treasury, “Decade-long infrastructure strategy to deliver stability, investment and national renewal”, 19 June 2025
[12] Department for Transport, “Road Investment Strategy 3 (RIS3): 2026 to 2031”, 26 March 2026
[13] Office for National Statistics, “Infrastructure in the UK: investment and net stocks”, 1 July 2026
[14] Government of Ireland, “Government publishes updated National Development Plan”, July 2025
[15] The White House, “Fact Sheet: Historic Bipartisan Infrastructure Deal”, 28 July 2021; archived by the American Presidency Project
[16] US House Committee on Transportation and Infrastructure, “BUILD America 250 Act”, May 2026
[17] National Stone, Sand & Gravel Association, “NSSGA Celebrates 70th Anniversary of Interstate System”, June 2026
[18] SNCF Group, “How we recycle ballast”, updated 13 October 2025
[19] New York State Comptroller, “Monitoring Town Asphalt Road Projects”, April 2013
[20] Martin Marietta, “First-quarter 2024 earnings conference call”, 30 April 2024; transcript
[21] UK Parliament, “Companies Act 2006, section 899”, 2006, as amended
[22] The Takeover Panel, “The Takeover Code: Rules 2.6, 2.7, 2.8 and 13.4 and Appendix 7”, current at 21 November 2026
[23] Baker McKenzie, “Effecting a takeover bid: United Kingdom”, n.d.
[24] Breedon Group plc, “Annual Results 2025”, 11 March 2026
[25] Starboard Value LP, “2026 Active-Passive Investor Summit”, October 2026; Knife River section
[26] InfraRed Capital Partners, “Infrastructure Strategic Outlook 2025”, 2025
[27] HM Revenue & Customs, “Rates for the Carbon Border Adjustment Mechanism (CBAM)”, 2026
[28] Department for Energy Security and Net Zero, “UK–EU ETS linking agreement: explainer”, 20 November 2026
[29] Carlsquare, “European Debt Markets Quarterly Insights 3 2026”, 10 August 2026
[30] Macquarie Asset Management, “Renewi acquisition financing commitment letter”, 2025
[31] US Silica Holdings, Inc., “Definitive merger proxy statement”, 2024; includes management’s adjusted 2024 EBITDA forecast
[32] PitchBook, “Europe’s leveraged loan market looks to September after record summer run”, August 2026
[33] International Financing Review, “Quikrete tests appetite with big M&A trade”, 2025
[34] PitchBook, “Quikrete brings 8th-largest M&A bond package on record to market”, 2025
[35] Latham & Watkins, “Latham Advises on Debt Financing for Quikrete’s US$11.5 Billion Acquisition of Summit Materials”, February 2025
[36] MSCI, “MSCI GBP High Yield Corporate Bond Index”, n.d.
[37] CNBC, “United Kingdom 7-Year Government Bond Yield”, market data; accessed 21 November 2026
[38] ATI Inc., “Second Amended and Restated Revolving Credit, Term Loan, Delayed Draw Term Loan and Security Agreement”, 13 June 2025
[39] National Infrastructure and Service Transformation Authority, “Infrastructure Pipeline kicks off new era of infrastructure delivery”, 17 July 2025
[40] Irish Concrete Federation, “Essential Aggregates”, June 2025
[41] National Stone, Sand & Gravel Association, “Aggregates Industry Economic Scorecard”, April 2025
[42] Wall Street Prep, “Acquisition Financing: LBO Capital Structure”, n.d.
[43] Office for National Statistics, “CPI INDEX 00: ALL ITEMS 2015=100 (D7BT)”, monthly data; accessed 21 November 2026
[44] Department for Business, Innovation, Science and Trade, “Building materials and components statistics”, monthly data; accessed 21 November 2026
[45] US Bureau of Labor Statistics, via FRED, “Producer Price Index: Construction Sand, Gravel and Crushed Stone (WPU1321)”, monthly data to October 2026
[46] US Bureau of Labor Statistics, via FRED, “Consumer Price Index for All Urban Consumers: All Items (CPIAUCNS)”, monthly data to October 2026
[47] Bloomberg, “FTSE 100, FTSE 250 and S&P 500 forward P/E (FY+1)”, 30 November 2021–17 November 2026; BSIC chart calculations



0 Comments