Significant changes are happening inside the fixed income markets, particularly in how investment managers decide to allocate their investments. Among asset managers, a prominent group is pension funds, which can influence markets given their significant AUM and their political and social consequences.
In this article we cover what is changing in their allocation process, focusing on two major allocators that have signalled possible significant changes to their mandates: the Norwegian sovereign fund, managed by Norges Bank Investment Management (NBIM), and the Japanese Government Pension Investment Fund (GPIF). In particular, we want to understand how these changes could affect US Treasury yields and the debt of other major countries, given their massive exposure to it.
We start with an overview of the debt structure in the US and who holds Treasuries at the different maturities. We then focus on the trends affecting the pension and sovereign fund space, with particular attention to the two funds above. Finally, we try to provide a comprehensive picture of the future changes.
Who owns Treasuries
The US federal government owes about $40tn in gross debt, but not all of it is held by investors. Roughly $8tn is intragovernmental, owed by one arm of the government to another. The largest piece is the Social Security retirement trust fund at $2.3tn. The remaining $31tn is debt held by the public, of this the ownership mix has shifted toward domestic investors. Domestic holdings rose from $7tn in March 2015 to $22tn in December 2025. The Federal Reserve is the largest single holder, having doubled its portfolio during COVID, and it has been shrinking it since June 2022. As of July 2026, foreign holdings stood at $9.25tn, roughly 30% of public debt.
Within the foreign share, the US Treasury’s Treasury International Capital (TIC) system, a monthly record of foreign holdings of US securities compiled from reports by US custodians and intermediaries, splits holders into official and private. Official holders (central banks, finance ministries and government-owned funds) held $3.77tn in July 2026, against $5.48tn for private investors. Since the start of the year, official holdings fell by $105bn while private holdings rose by $83bn. The decline is led by Japan (-$82bn) and China (-$66bn).

TIC also reports holdings country by country. It comes with an important limit: holdings are attributed to the country of the custodian, not the owner. Treasury calls this “custodial bias” and notes that it “contributes to the large recorded foreign holdings of U.S. securities in major financial centers.” The UK, Belgium, Cayman, Luxembourg and Ireland together hold $2.7tn, about 29% of the total, and these are financial centres rather than end investors. Cayman is a particular problem: a Fed report from October 2025 found US hedge funds domiciled there (basis-trade positions) were undercounted by about $1.4tn. With that in mind, Table 2 shows the ten largest recorded holders.

In dollar terms, the largest official holders have been shrinking while financial centres have grown. Japan, still the largest holder at $1.10tn, is down $82bn this year and $127bn since 2014 (-10%). China has halved its holdings since 2014 (-$626bn, to $618bn) and is down a further $66bn in 2026. The UK went the other way: up $135bn this year and $819bn since 2014, to $998bn, making it the second-largest holder. Canada (-$42bn) and France (-$21bn) also fell this year, although both remain far above their 2014 levels. Overall, foreign holdings rose by $3.1tn (+50%) since 2014: private holdings rose by $3.4tn, while official holdings fell by $350bn.
Shares tell the same story relative to the size of the market. Foreign holders owned 47% of public debt at the end of 2014 and about 29% in July 2026. The official share fell from 32% to 12%, while private foreign holdings edged up from about 16% to 17%. Japan and China together went from about 40% of foreign holdings to about 19%, while the UK alone rose from 3% to 11%.

Not all Treasuries are equal: what pension and sovereign funds buy depends on maturity. Of the $31.8tn of marketable Treasuries outstanding in August 2026, about 23% were bills (maturity of one year or less), 51% notes, 17% bonds, 7% inflation-protected securities (TIPS) and 2% floating-rate notes. Measured by remaining maturity, the stock is short: 34% ($10.8tn) matures within a year, including about $3.5tn of coupon-bearing securities that are close to maturity, and 68% matures within five years. The long end is much smaller: securities with more than ten years left make up 18% ($5.8tn), and those beyond twenty years about 9% ($2.9tn).
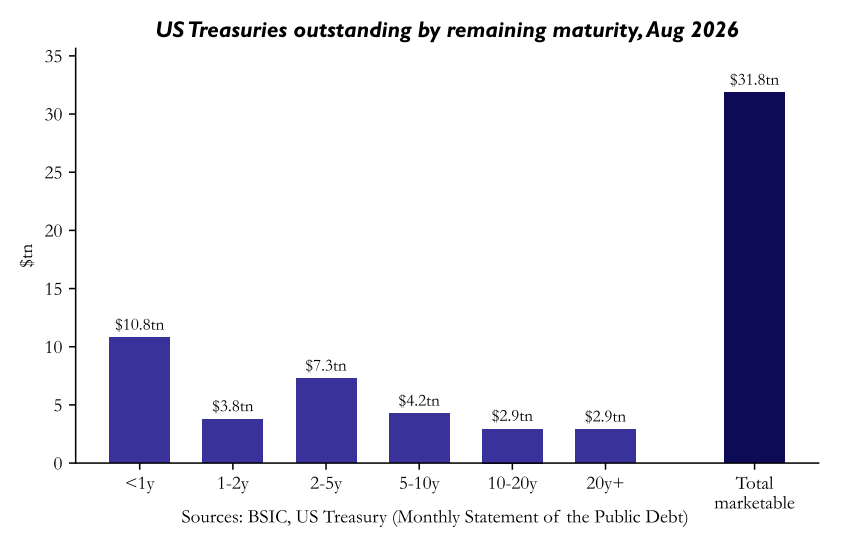
Large funds without explicit liabilities do not mirror this shape at the short end. Japan’s GPIF, the one large fund that publishes security-level holdings, held ¥36.8tn of US Treasuries in March 2026, 51% of its foreign bonds. Only 1% was due within a year, against 34% of the market, and its average remaining maturity was 7.7 years. Excluding the under-one-year bucket, its profile is close to the market’s, with a slightly smaller long end (about 21% beyond ten years against about 27%). Norway’s NBIM follows the same logic by design: it excludes bonds with under a year left and lets issuers set the maturity structure, though it does not publish a maturity split. It held about $210bn of US government bonds, 34% of its bond book, in June 2026. Liability-driven funds are the exception: ABP, for example, runs an explicit long-duration allocation.

Longer Trends in Pension Fund Asset Allocation
Before looking at individual allocators, it helps to see the broader trends reshaping how pension investors hold fixed income, because they set the backdrop for any single fund’s decision and affect Treasuries before it. A June 2026 BIS paper on global pension asset allocations (Ding, Fang, Hardy and Lewis, BIS Papers No 172) documents three of them, summarised below:
- From bonds to funds, and lower exposure overall. Direct bond holdings have fallen in every region. US pension funds went from over 35% of assets in the 1980s to below 15% in recent years, advanced Europe from about 35% to 20% since the early 2000s, and emerging markets from about 80% to 50%. Most of the money went into mutual funds (over 25% of US assets, over 50% in advanced Europe), but looking through them does not restore the exposure: in four European countries (Germany, Italy, Portugal and Switzerland) the rise in indirect bond holdings is too small to offset the fall in direct ones.
- From public to private debt. In the US, public debt (Treasuries, agency and GSE securities, and municipals) fell from about 11% of pension assets in the late 1980s to about 5% by 2025, while private debt fell less and has edged up since 2005. Alongside this, alternatives rose from below 10% to above 30% of US state and local plan assets by 2024, with pensions becoming larger providers of private credit.
- From defined benefit to defined contribution. More countries are moving from DB plans to DC plans, where the member bears the investment risk. Both types have moved from direct bonds into funds, with DB plans cutting direct bonds more and DC plans moving further into equities and funds. See our earlier piece, Turn of the Tide: The Dutch Pension Reform and Its Impact on Markets.
Norways’s Government Pension Fund Global
The Government Pension Fund Global, managed by Norges Bank Investment Management (NBIM), is the world’s largest sovereign wealth fund. At the end of June 2026 it held NOK 22.7tn (about $2.3tn). On 1 September 2026 Norges Bank sent the Ministry of Finance advice on how the bond part of the fund’s benchmark should be rebuilt. At the time of writing the Ministry has not responded. Its expert group on the fund’s purpose and risk tolerance reports on 25 January 2027.
How the benchmark works today
The benchmark is set by the Norwegian Ministry of Finance, not by NBIM. The management mandate fixes the strategic split at 70% equities and 30% bonds and defines the bond index as a custom blend of Bloomberg sub-indices. NBIM manages the portfolio against it within an expected tracking-error limit of 1.25 percentage points for the fund as a whole. Today the bond index is 70% government and 30% corporate:
- Government half: nominal and inflation-linked bonds of developed markets, plus supranationals.
- Corporate half: corporate and covered bonds in seven currencies, at market weights.
Today’s index excludes emerging markets, high yield, agency mortgage-backed securities (MBS) and other securitised and government-related bonds, although the fund may hold some of them within its limits.
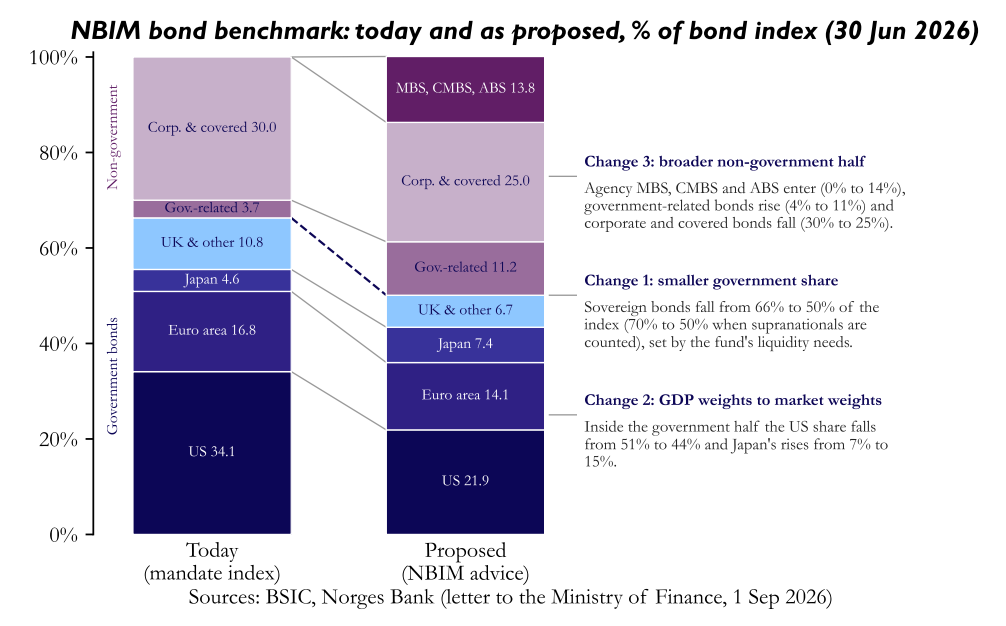
The Ministry’s questions of 25 February 2026 targeted this design. They asked whether GDP weighting still diversifies sovereign risk, whether large markets such as US MBS should stay out, and whether duration should follow issuers’ maturities. Norges Bank’s answer is three changes: a smaller government share, a different weighting inside it, and a broader non-government half .
Change 1: fewer government bonds, from 70% to 50%
The headline change is the split between government and other bonds, from 70/30 to 50/50. The share stays fixed and is rebalanced monthly. Supranationals count as government today (3.7% of the index). They would move to the non-government half. The like-for-like cut in sovereign bonds is therefore from 66.3% to 50.0% of the index. Bonds are 30% of the fud’s benchmark, so government bonds fall from 21% (including supranationals) to 15% of it.
Norges Bank’s case rests on the three factors. The first one is fluctuations, it matters more that the fund holds bonds than which bonds it holds. Over 1995-2025 a 70/30 portfolio had annualised volatility of 10.7-11.5% whether the bond part was government bonds, corporate bonds or MBS, against 15.3% for equities alone. The differences show up in crises. In the dotcom bust, the financial crisis and the pandemic, government bonds had a correlation with equities of -0.34 and corporate bonds of +0.42. MBS moved slightly with equities in normal times and against them in crises. A smaller government share therefore costs little in normal markets and somewhat more in a crisis, which is why the Bank wants government bonds to remain a substantial share.
The 50% figure is mainly driven by liquidity. Under the fund’s rebalancing rule, when the equity share falls more than two percentage points below 70%, the fund sells bonds and buys equities. This means selling bonds that can be traded in large volumes without significantly affecting prices. Nominal government bonds of large developed markets are the natural source because their turnover remains stable even during periods of market stress. US government bonds trade about $1,056bn a day, compared with about $354bn for agency MBS and $59bn for US corporates.
NBIM simulated 2,000 fifty-year paths by resampling US monthly returns from 1973 to 2025. It recorded the largest bond sales needed in a single rebalancing episode:
- The average worst episode requires sales of 5.5% of the fund’s value, the 90th percentile 9.4% and the 95th percentile 10.7%, over episodes lasting about 7.3 months.
- At the extreme, sales equal just under 40% of the bond portfolio. A government share of 40% would therefore be enough.
- NBIM recommends 50% to keep a margin, because the fund will be larger, equities may be more volatile and rebalancing may be triggered over shorter spells than in the sample.
The third factor is that Government bonds beyond the liquidity need carry an implicit cost, because other segments have paid more per unit of risk. Over 1995-2025 US government bonds earned a Sharpe ratio of 0.41, against 0.57 for agency MBS, 0.53 for corporates and 0.58 for government-related bonds. A 50% share is also closer to the market, where government bonds are slightly more than half of the Bloomberg Global Aggregate.
Change 2: inside the 50%, from GDP weights to market weights
The second change alters how it is divided between countries. Today weights follow GDP. Countries with large economies relative to their government debt get more weight than their share of the market, and heavy borrowers get less. The proposal replaces this with market weights, each country’s share of outstanding developed-market government debt (nominal and inflation-linked). The set of markets is fixed at the transition, when the freeze on adding new government markets is lifted once. It is then held constant until the next major review of the index.
GDP weights were introduced in 2012 because they were thought to diversify better against sovereigns’ capacity to service debt. Japan, the heaviest borrower relative to GDP, gets 7.0% under GDP weights against 15.9% under market weights. Norges Bank now gives four reasons to drop them:
- High debt has become widespread. High debt used to be a feature of a few countries, notably Japan and some euro-area members. It is now general across developed economies, so GDP no longer separates safer from riskier borrowers.
- GDP weights did better in the past, but for one reason. Between 2001 and 2025 a GDP-weighted bond index returned 142%, against 126% for a market-weighted one. Most of the gap came from Japan: GDP weights held little Japanese debt, and Japanese bonds lost value for a dollar investor as the yen fell.
- Market weights self-correct. Countries with weak public finances pay higher yields, which limits their weight over time.
- GDP weighting adds complexity. It is the largest source of complexity and operational risk in today’s customised index, and it makes the index hard to verify.
However, Market weights have a weakness too. Government bond prices are not set only by a country’s finances: demand from regulated investors such as pension funds, central bank purchases and the supply of bonds all move them. A market-weighted index therefore holds more of whatever has been pushed up in price. NBIM’s answer is that over long horizons yields mostly track inflation expectations and the equilibrium real rate. Any shorter-term mispricing is left to active management, not built into the benchmark.
The overall result of this change inside the government half is a rotation towards Japan and the euro area. The US share falls from about 51% to about 44%, Japan’s rises from about 7% to about 15%, and other developed markets halve.
Change 3: what fills the other half
The non-government half grows from 33.7% to 50% of the bond index and changes composition:
- Corporates: fall from 26.8% to 22.4% and covered bonds from 3.2% to 2.6%.
- New bonds: agency MBS (0% to 12.8%), government-related bonds other than supranationals (0% to 7.6%), and small slices of CMBS and ABS (0% to 1.0%).
- Corporate bonds in more currencies. Today the index only includes corporate bonds issued in seven currencies (US dollar, euro, pound, Canadian dollar, Swiss franc, Danish krone and Swedish krona). The proposal adds those issued in yen, Australian dollars, New Zealand dollars and Singapore dollars.
The logic is to earn more distinct risk premiums. The index moves, in the letter’s words, from being dominated by the term premium on government bonds to a more balanced exposure to several sources of return. Each segment pays a different premium:
- Corporates: a credit premium, for default risk and lower liquidity.
- MBS: a prepayment premium, because borrowers can refinance.
- Government-related bonds: a liquidity premium plus a small credit premium, because they carry implicit or explicit state support but trade less than large-market government bonds.
Agency mortgage-backed securities (MBS) are the most significant additions. They are bonds backed by pools of US home loans and guaranteed by Ginnie Mae, which carries the full backing of the US government, and by Fannie Mae and Freddie Mac, which carry an implicit federal guarantee. They therefore carry almost no credit risk and are often treated as quasi-sovereign debt. Their distinctive risk is prepayment: US borrowers can repay their mortgage at any time, which they do when rates fall, so investors get their money back just when reinvesting is least attractive. Over 1995-2025 agency MBS earned 2.3% a year more than Treasuries of the same duration, and still 1.9% after removing the effect of equity and interest-rate moves. The market is large and liquid, with about $7.5tn outstanding at the end of 2025 and about $350bn traded daily. MBS have also tended to move against equities in crises, as government bonds do. However, NBIM also notes that the premium has shrunk over the past decade, possibly because of the Federal Reserve’s own MBS purchases and because the market became more liquid. Norges Bank also removed MBS from its index in 2012, after the private-label MBS it held through external mandates became illiquid in the financial crisis.
 Net effect and implementation
Norges Bank describes the effect on expected return and risk as small. On 30 June 2026 the proposed index yields 4.04% against 3.99%, which is 10bp more after adjusting for duration, mostly from MBS. In a backtest on a fixed developed-market universe, the proposed index would have returned less over 2015-2026 (0.76% a year against 0.97%), with slightly lower volatility. The Bank attributes the gap mainly to GDP weights, meaning the Japan underweight, not to the new segments.
 What it means for Treasuries
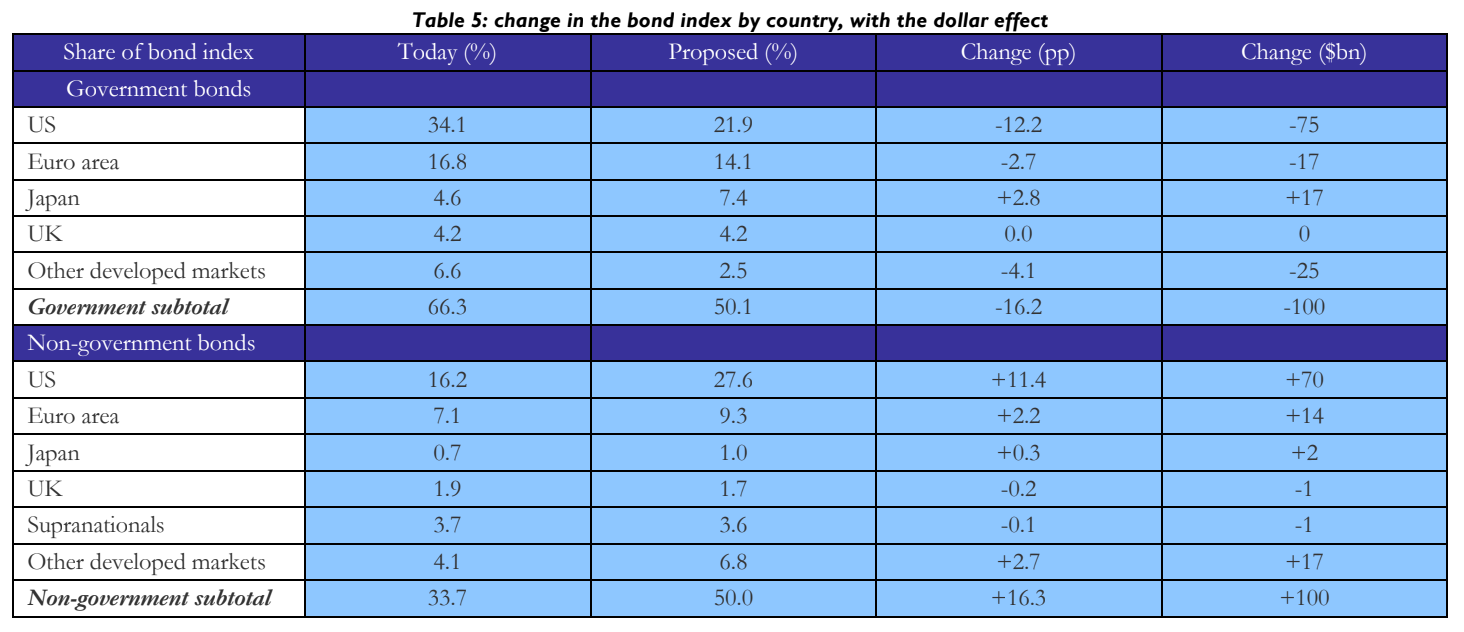
The US government share of the bond index falls from 34.1% to 21.9%. Applied to the $615bn bond book in NBIM’s June 2026 holdings file, the fall is about $75bn. That is about a third of the $210bn US government line, which includes inflation-linked Treasuries. At the same time $70bn of US non-government bonds are added, mostly agency MBS, so US exposure in the index is almost unchanged (50.3% to 49.5%).
Japan’s Government Pension Investment Fund
Japan’s Government Pension Investment Fund (GPIF) is the world’s largest pension fund, with ¥320tn ($2tn) of reserves at end-June 2026. In recent months, several developments have put the fund at the centre of global attention: JGB yields have climbed to their highest since the 1990s, and the government has begun saying in public that it wants pension money invested in Japan. In August, GPIF’s board met outside its normal calendar to discuss its portfolio.
How the allocation works today
GPIF does not set its allocation freely. Every five years the Ministry of Health, Labour and Welfare (MHLW) checks the finances of the pension system and sets GPIF’s medium-term objectives. GPIF then builds a policy asset mix to meet them. The mix is approved by GPIF’s Board of Governors, discussed with the Social Security Council’s fund management subcommittee, and authorised by the MHLW minister as part of GPIF’s medium-term plan. The current fifth period runs from April 2025 to March 2030. GPIF verifies the mix every year and can revise it mid-period if the environment it assumed has changed materially.
The GPIF must earn a real return of 1.9% above nominal wage growth at minimum risk. The risk test is that the chance of falling short of wage growth must be no higher than for a portfolio made only of domestic bonds. No limit is placed on the relative size of any asset.
At its current composition, each of the four asset classes (domestic bonds, foreign bonds, domestic equities and foreign equities) has a 25% target. Total bonds and total equities must also each stay within 50% ±9pp. Two classification rules matter for what follows:
- Currency-hedged foreign bonds count as domestic bonds, because their risk looks like JGBs.
- Alternatives (private equity, infrastructure, real estate) are not a separate class. They sit inside the four buckets according to their risk, with an overall cap of 5%.
In practice GPIF stays very close to 25/25/25/25. The average gap to target fell from over 3pp in 2015-2019 to about 1pp in 2020-2024. The current mix comes from two large shifts. In October 2014, an expert panel had argued that a JGB-heavy portfolio could not earn enough once deflation ended. GPIF cut domestic bonds from 60% to 35%, raised foreign bonds from 11% to 15%, and moved both equity classes to 25%. In April 2020 it moved another 10pp from domestic to foreign bonds. Foreign bonds went from 8% of the portfolio in 2006 to 25% today. At end-June 2026 the mix was 25.6/24.6/24.5/25.3 (domestic bonds, foreign bonds, domestic equities and foreign equities), inside every band.
Why is it changing
The 10-year JGB yield rose from 2.35% to about 3.1% in early October, with the 30-year above 4.1%. Higher yields at home weaken the case GPIF made in 2014 and 2020 for favouring foreign bonds.
The political push began on 10 July, when Finance Minister Satsuki Katayama said she wanted to “pursue measures that encourage pension funds, including GPIF, to invest further in Japan’s financial assets,” prompting a rally in Japanese stocks, bonds and the yen. On 13 July, Chief Cabinet Secretary Minoru Kihara added that GPIF reviews its portfolio every year and that it “will be revised if such changes make adjustments necessary.” Government sources nevertheless told Reuters that there were “no immediate plans” to alter the fund’s allocation targets, while noting that the government could work within the existing allowable ranges to direct more investment towards domestic assets. The political pressure continued on 17 July, when Prime Minister Sanae Takaichi told the upper house budget committee that measures supporting GPIF’s investment in Japanese financial assets were important.
However, on 14 July, Health Minister Kenichiro Ueno, whose ministry supervises GPIF, stressed that the fund is managed “solely for the benefit of the insured.” He argued that the investment environment had not diverged significantly from the assumptions underlying the existing portfolio and that a review would therefore take place only “if necessary.” Ueno also emphasized that the allocation bands were designed to provide flexibility and that GPIF deliberately keeps deviations from its targets limited. This position was reinforced on 27 July by GPIF president Kazuto Uchida, who said that the fund would act only in the interests of its beneficiaries.
Unexpectedly, on 21 August, GPIF’s board held its 126th meeting. The agenda, published on 31 August, included a report on “discussions in the Basic Portfolio Verification PT.” However, the official position didn’t change and on 8 September, Ueno reiterated that there had been no need to review the basic portfolio and said that the regular verification process was continuing.
Two Scenarios
Given the current environment, we see two main scenarios for GPIF. All estimates start from end-June 2026, when reserves were ¥320.4tn and foreign bonds made up 24.60% of the portfolio.
Scenario 1: using the bands
GPIF would keep the 25/25/25/25 targets but run foreign assets near the bottom of their bands and domestic assets near the top. With foreign bonds at their 20% floor and foreign equities at 19%, the domestic share could reach 61%, about ¥31tn (210 $b) more than at end-FY2025. For Treasuries only the foreign-bond leg matters:
- Cutting foreign bonds from 24.6% to 20% removes ¥14.7tn ($93bn) of foreign bonds, which domestic bonds can absorb (25.6% → 30.2%, under the 31% cap).
- Pro rata, that is ¥7.5tn ($47bn) of Treasuries, about a fifth of GPIF’s Treasury book.
- Going only halfway down the band (to 22.5%) would mean about $21bn pro rata.
There are two caveats with this. First, the bands are meant for short-term flexibility, not a lasting tilt. GPIF is judged against its benchmark and barely uses them: at end-March its largest deviation was +1.9pp against a ±6pp band. Second, because hedged foreign bonds count as domestic bonds, GPIF could cut “foreign bonds” without selling a single Treasury, by hedging the dollar exposure. That would hit USD/JPY rather than Treasuries.
Scenario 2: a new basic portfolio
GPIF’s board would re-run its optimisation using today’s higher JGB yields and propose a new mix. The new mix would then go to the Social Security Council and would need MHLW approval. Whatever the board chose, it would still have to show that the portfolio can deliver wage growth plus 1.9% at minimum risk. The two previous overhauls show that this process can be completed within a year. In November 2013, a government expert panel chaired by Takatoshi Ito argued that a JGB-heavy portfolio could not earn the returns pensions needed once deflation ended. Eleven months later, on 31 October 2014, GPIF adopted a new mix: domestic bonds fell from 60% to 35%, foreign bonds rose from 11% to 15%, and both equity classes went from 12% to 25%. The 2020 change followed the same path. The board discussed the five-yearly review through 2019 and the new 25/25/25/25 mix took effect in April 2020, moving another 10pp from domestic to foreign bonds. In this case, we see two main possibilities:
- A new split: 35/20/25/20. In this case GPIF would move to 35% domestic bonds, 20% foreign bonds, 25% domestic equities and 20% foreign equities, the mix suggested by Citi’s strategists. Domestic bonds would rise by 10pp, funded half by foreign bonds and half by foreign equities. Foreign bonds would fall 4.6pp from today’s level, which means about $47bn of Treasuries sold pro rata, as in Scenario 1. The difference is that the change would be permanent, and a new band around a 20% target would let foreign bonds fall further.
- A return to the 2014 split: 35/15/25/25. In this case GPIF would go back to the mix it held between 2014 and 2020: 35% domestic bonds, 15% foreign bonds, 25% domestic equities and 25% foreign equities. This would fully reverse the 2020 shift into foreign bonds. Foreign bonds would fall to 15%, removing ¥30.7tn ($194bn). Pro rata, that is ¥15.6tn ($98bn) of Treasuries, about two-fifths of GPIF’s Treasury book.
What it means for Treasuries
About $47bn in Treasuries would be sold if GPIF uses its bands or moves to 35/20/25/20, and about $98bn if it returns to the 2014 split. In addition, since 60% of GPIF’s Treasuries mature in 2-10 years, most of the selling would land in the belly of the curve. The effect could be softened if GPIF hedged the dollar instead of selling Treasuries, which would push the pressure onto USD/JPY.

Transmission and sizing in Treasuries
Having learned about these movements in the pension sector, one very important question remains: “Are the NBIM and GPIF reallocations large enough to affect Treasury yields?” To answer this, we will size the flows against two benchmarks. Firstly, we will compare them to the treasury supply, and then to foreign holdings.
Sizing the flows
As previously mentioned, the NBIM’s proposal involves reducing US government bonds by around $75bn. This change to a new benchmark index is said to be implemented gradually. To facilitate this transition, an estimate of around 750mln kroner has been introduced, which can be significantly reduced through gradual implementation. One possible way to achieve this is through the reinvestment of maturing bonds, offsetting existing active positions and other capital flows in the fund. There is no concrete timeline yet besides this information. The implementation plan will be produced once the Ministry has made a decision. If NBIM relied primarily on reinvesting maturing bonds, the reduction would manifest as a lack of demand at auctions rather than outright selling.
Within the band limit, GPIF can move a maximum of around $93bn out of foreign bonds. Since Treasuries represent 51% of its foreign bonds, this would equate to a sale of around $47bn of Treasuries. Alternatively, if it returns to the 2014 split (see Table 6), it could sell around $98bn of Treasuries. Together with NBIM, this would equate to a maximum reduction of $122bn in Treasuries in the main case and $173bn at the upper limit.
Against Treasury supply
Examining the Treasury’s announced auction sizes for August-October 2026 reveals that $69bn of two-year notes, $58bn of three-year notes, $70bn of five-year notes, and $44bn of seven-year notes were issued per month. Furthermore, in August, September and October, they issued $42bn and $39bn twice of 10-year treasuries, $16bn and $13bn twice of 20-year treasuries, and $25bn and $22bn twice of 30-year treasuries, respectively. As these sizes are also expected to be maintained for at least the next several quarters, this equates to an annual issuance of $3.82tn. The maximum total reduction of the funds only represents between 3.2% and 4.5% of this annual supply. The 6-8 October auctions of 3-year, 10-year and 30-year notes alone had a total volume of $119bn. However, the funds’ investment allocation across the different maturities does not reflect the issuance volumes. We therefore need to take a closer look at the combined amounts of the different maturity buckets. As NBIM does not provide information on the exact structure, it is very difficult to make any meaningful calculations, so we assume that it has the same profile as GPIF.
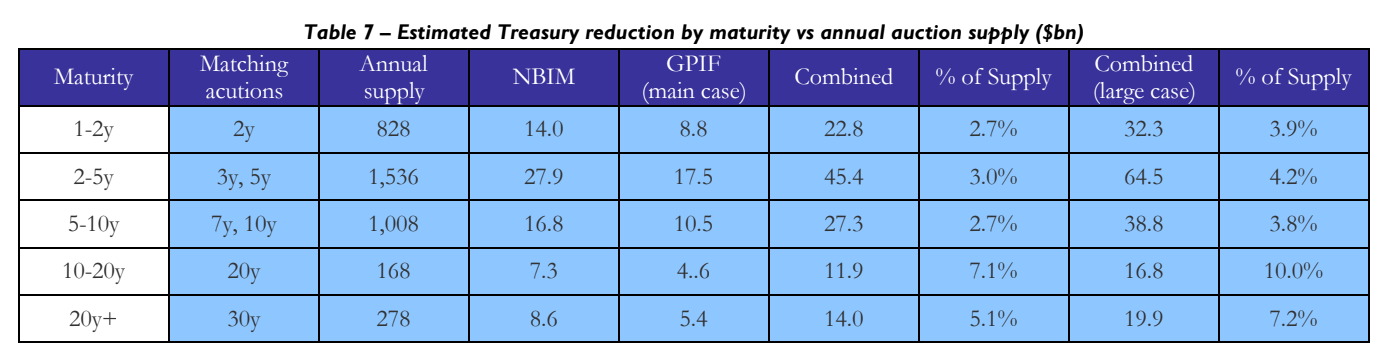
In absolute terms, the majority of the reduction occurs in the belly. However, if you compare it to the issuance volumes, the long end is reduced the most relatively. More precisely, the reduction equates to 7.1% of the year’s 20-year supply and 5.1% of the year’s 30-year supply, compared to around 3% in the 2-10-year buckets. The difference is even clearer in the largest case: 10% and 7.2% for the long end, compared to around 4% for the shorter maturities. While these shares are not insignificant, they are still relatively small, especially since NBIM’s movement would be gradual. Consequently, the two funds alone are very unlikely to influence auction outcomes.
However, when viewed from another angle, the pressure could build over time. The CBO projects deficits of $1.9tn in FY2026 and FY2027. This would cause debt held by the public to rise from 101% to 120% of GDP by 2036. The funds’ $122bn is therefore around 6% of one year’s deficit, while the large case’s $173bn would equate to around 9%. Since the Treasury is holding coupon sizes “for at least the next several quarters”, changes in financing are being made through treasury bills. Moreover, the Fed has ended QT and is now only reinvesting in bills, meaning that no one is adding long-term demand. When the coupon sizes eventually rise, more long-dated supply will meet fewer price-insensitive buyers, resulting in a higher term premium. The funds’ lower future demand, and the potential for other funds to follow suit, would intensify this effect. This mechanism could pose a medium-term risk to treasuries, even though the initial share of the funds in the overall debt is very small.
Against Foreign Holdings
As of July 2026, foreign holdings totalled $9.248tn, of which $3.773tn was held by official institutions. $1,103.9bn was linked to Japan. However, the total maximum reduction of the funds only amounts to 1.3% or 1.9% (in the large case) of foreign holdings, while GPIF’s reduction equates to 4.3% or 8.9% (in the large case) of Japan’s holdings. It is important to note that TIC attributes holdings to the country of the custodian or intermediary rather than the actual owner. As neither NBIM nor GPIF discloses how it holds its treasuries, the reductions cannot be reliably tracked in the country data.
Price impact
In order to approximate the actual impact of the funds, we intend to apply Hamilton and Wu’s estimates (2012). Hamilton and Wu estimate the effect of changes in the maturity structure of Treasury debt held by the public on yields. They achieve this by using a term-structure model fitted to pre-crisis data. For instance, they found that if the Fed were to purchase $400bn of the longest-maturity Treasuries and finance this by selling short-term ones, the 10-year yield would fall by around 13 basis points. Using this as a rough guide, a reduction of this size would only be worth a few basis points on the 10y yield. Hamilton and Wu’s estimates come from a much smaller market and measure a Fed maturity swap rather than a shift in investor demand; in today’s market, several times larger, the effect per dollar is, if anything, likely to be smaller.
Other affected assets
The capital flowing out of treasuries has to go somewhere else. These assets would therefore also experience a significant new demand. We now want to take a closer look at the two largest destinations that would be affected by such a reallocation of assets.
Japanese government bonds
Japanese government bonds (JGBs) are expected to experience the largest capital inflow. If it used its bands, GPIF would reallocate an additional ¥14.7tn ($93bn), and under a new 35% domestic bond target, this figure would increase to about ¥30.1tn ($191bn). In addition, NBIM’s shift would contribute an extra ¥2.7tn ($17bn). The two funds combined would therefore add ¥17-33tn. While this would make up 1.7-3.3% of the ¥1,006.5tn market, it would represent a significant 10-19% share of this fiscal year’s ¥168.5tn market issuance. This is a much larger share than the funds’ treasury reduction. Moreover, the timing is also very important here. As the Bank of Japan (BoJ) still holds 46.7% of JGBs, is currently reducing its purchases and is projected to shed roughly ¥40-50tn a year, the funds could absorb much of the supply that the BoJ leaves behind. However, these figures are upper bounds. The GPIF’s domestic-bond portfolio also includes yen corporates and hedged foreign bonds.
US agency MBS and government-related bonds
When considering agency MBS and government-related bonds, it is important to note that only NBIM would add these assets, not GPIF. For NBIM, most of the money remains in the US. The share of agency MBS would rise from zero to 12.8%, equating to around $79bn. Additionally, $47bn would flow into government-related bonds across several countries, for which NBIM does not publish a country split, and $6bn into CMBS and ABS. Overall, NBIM’s investment in the US is unlikely to change significantly, remaining around 50%. However, to ideally evaluate the impact, we need to consider the size of the markets. The agency MBS market is worth around $7.5tn. The $79bn is therefore only around 1%, and less than a quarter of a single day’s trading ($368.6bn on average in 2026). Another factor is the timing. The Fed currently holds $1.9tn of MBS, but has previously cut its holdings by $188bn over the past year.. If the NBIM were to actually reallocate their money in the above-described manner, it would offset approximately two-fifths of one year’s worth of runoff. This would also create a new long-term buyer. If the Ministry adopts the proposal, the direction will be fairly clear. However, the timing would not be clear, since there is no implementation plan yet and Norges Bank notes that it would first need to build up MBS expertise. This again indicates a longer period of time that the change would need.
Conclusion
With this article we wanted to examine how two of the world’s largest public investors are rethinking their allocation to government bonds, and what that could mean for Treasuries. NBIM has formally proposed cutting its US government bonds by about $75bn, while GPIF could shift $47-98bn out of Treasuries if political pressure and higher JGB yields push it towards domestic bonds. Even combined, these flows are small against Treasury supply and foreign holdings, and they would likely be phased in gradually, showing up as weaker demand at future auctions rather than as outright selling. Their relative weight is larger at the long end, though, and their importance lies in the signal. If the world’s largest sovereign fund and largest pension fund decide they need fewer Treasuries, other allocators are likely to reconsider too. The most likely path is therefore a slow loss of price-insensitive, long-dated demand, just as the Fed buys only bills and larger coupon issuance lies ahead, adding gradual upward pressure on the term premium. Outside the US, the effects could be more visible: the same flows would be a meaningful share of JGB issuance and a new source of demand for agency MBS.
References
[1] Ding, …, Fang, …, Hardy, …, Lewis, …, “Global Pension Asset Allocations and Debt Markets”, BIS Papers No 172, Bank for International Settlements, 2026
[2] Norges Bank, “Analyses and Assessments of the Investment Strategy for Bonds”, Letter to the Ministry of Finance, 2026
[3] Government Pension Investment Fund, “Policy Asset Mix for the Fifth Medium-Term Objectives Period – Details”, GPIF, 2025
[4] Government Pension Investment Fund, “Investment Results for 1Q of Fiscal 2026”, GPIF, 2026
[5] Okuda, Koji, “Is There Room for GPIF to Expand Domestic Investment? Three Possible Means”, Dai-ichi Life Research Institute, 2026
[6] Shiomura, Kenji, “What the August Meeting of GPIF’s Board of Governors Means”, Daiwa Institute of Research, 2026
[7] Hamilton, James D., Wu, Jing Cynthia, “The Effectiveness of Alternative Monetary Policy Tools in a Zero Lower Bound Environment”, Journal of Money, Credit and Banking, 2012
[8] Gagnon, Joseph, Raskin, Matthew, Remache, Julie, Sack, Brian, “The Financial Market Effects of the Federal Reserve’s Large-Scale Asset Purchases”, International Journal of Central Banking, 2011
[9] Greenwood, Robin, Vayanos, Dimitri, “Bond Supply and Excess Bond Returns”, Review of Financial Studies, 2014
[10] U.S. Department of the Treasury, “Treasury International Capital (TIC) System – Major Foreign Holders of Treasury Securities”, 2026
[11] Congressional Budget Office, “The Budget and Economic Outlook: 2026 to 2036”, 2026
[12] U.S. Department of the Treasury, “Quarterly Refunding Statement of Deputy Assistant Secretary for Federal Finance”, 2026
[13] Federal Reserve Bank of New York, “Statement Regarding Reserve Management Purchases and Treasury Reinvestments”, 2025
[14] U.S. Department of the Treasury, “Daily Treasury Par Yield Curve Rates”, 2026
[15] Board of Governors of the Federal Reserve System, “H.10 Foreign Exchange Rates”, 2026
[16] Ministry of Finance Japan, “Breakdown by JGB and T-Bill Holders”, 2026
[17] Ministry of Finance Japan, “FY2026 JGB Issuance Plan”, 2026
[18] Bank of Japan, “Plan for the Outright Purchases of Japanese Government Bonds”, 2026
[19] Securities Industry and Financial Markets Association (SIFMA), “US Mortgage-Backed Securities Statistics”, 2026
[20] Board of Governors of the Federal Reserve System, “H.4.1 Factors Affecting Reserve Balances”, 2026


0 Comments