Real estate is traditionally associated with large capital expenditures and not a high amount of liquidity. Hence, the sector is usually reserved for long-term investments by high net worth individuals. Even more so, commercial use buildings are out of reach for most private individual’s pockets, making developers and other large entities to be the only one able to profit off such investments. However, this is not entirely true, as Real Estate Investment Trusts (REITs) make investing in the sector accessible to just about anyone in the same way as trading stocks. This article will aim to introduce their basics and look at their performance across business cycles.
What is a REIT?
While some could think of REITs as dividend paying stocks, this is not quite an accurate description. A REIT is a unique type of company that allows investors to pool their money in order to invest in real estate assets that would otherwise be off limits for their individual contributions.
Requirements for a company to classify as a REIT (quoted from Nareit):
- Invest at least 75% of its total assets in real estate
- Derive at least 75% of its gross income from rents from real property, interest on mortgages financing real property or from sales of real estate
- Pay at least 90% of its taxable income in the form of shareholder dividends each year
- Be an entity that is taxable as a corporation
- Be managed by a board of directors or trustees
- Have a minimum of 100 shareholders
- Have no more than 50% of its shares held by five or fewer individuals
Two types of REITs:
- Equity REITs: real estate investment trusts that own properties as their primary business.
- Mortgage REITs (mREITs): mortgage REITs invest in mortgages, mortgage-backed securities, and other mortgage-related assets. Usually these companies utilize the spread between short term and long term borrowing costs..
Business Cycles and REITs
This research summary aims to give an overview of REIT returns at different points in the business cycle. This is done in order to be able to make conclusions about past results and form expectations about possible future behaviors of REITs.
The index used to calculate returns was the S&P UNITED STATES REIT U$ – RI, while the Conference Board Leading Economic Index (CBLEI) was used to determine different points in the business cycle. The period researched starts in July 1990 which marks the beginning of the first recession for which the index exists and ends mid-2019.
Due to the special nature of the 2001 to 2009 business cycle, 2 different designations were made for possible business cycle phases in that period. Additionally, for both of the differently designated business cycle phases, an analysis excluding the 2008 financial crisis and its following recovery was done to be able to eliminate the adverse data that period yielded.
When looking at the business cycle phase designation graphs, the following components are kept universal amongst the 2 of them:
- The red line of the graph represents the CBLEI on a monthly basis.
- The blue line represents the 12-month moving average of the CBLEI, and its corresponding rate of change is graphed below the original graph.
- The green line represents the United States GDP on a quarterly basis.
- Red dividers mark recessions.
- Blue dividers mark business cycle phases in their respective order.
The general methodology for business cycle designations was as follows:
- The first evident peak in the rate of change of the moving average graph marks the end of the Early Cycle.
- The next evident peak after which the CBLEI doesn’t retrace to a positive rate of change marks the end of the Mid Cycle and the beginning of the Late Cycle.
- Recession beginnings are sourced from outside official data provided by the Fed, due to the CBLEI dropping to negative growth rates at different periods in advance, as some recessions are more clearly signaled to be coming than others.
- The endings of the recessions are marked when the CBLEI’s rate of change increases once again.
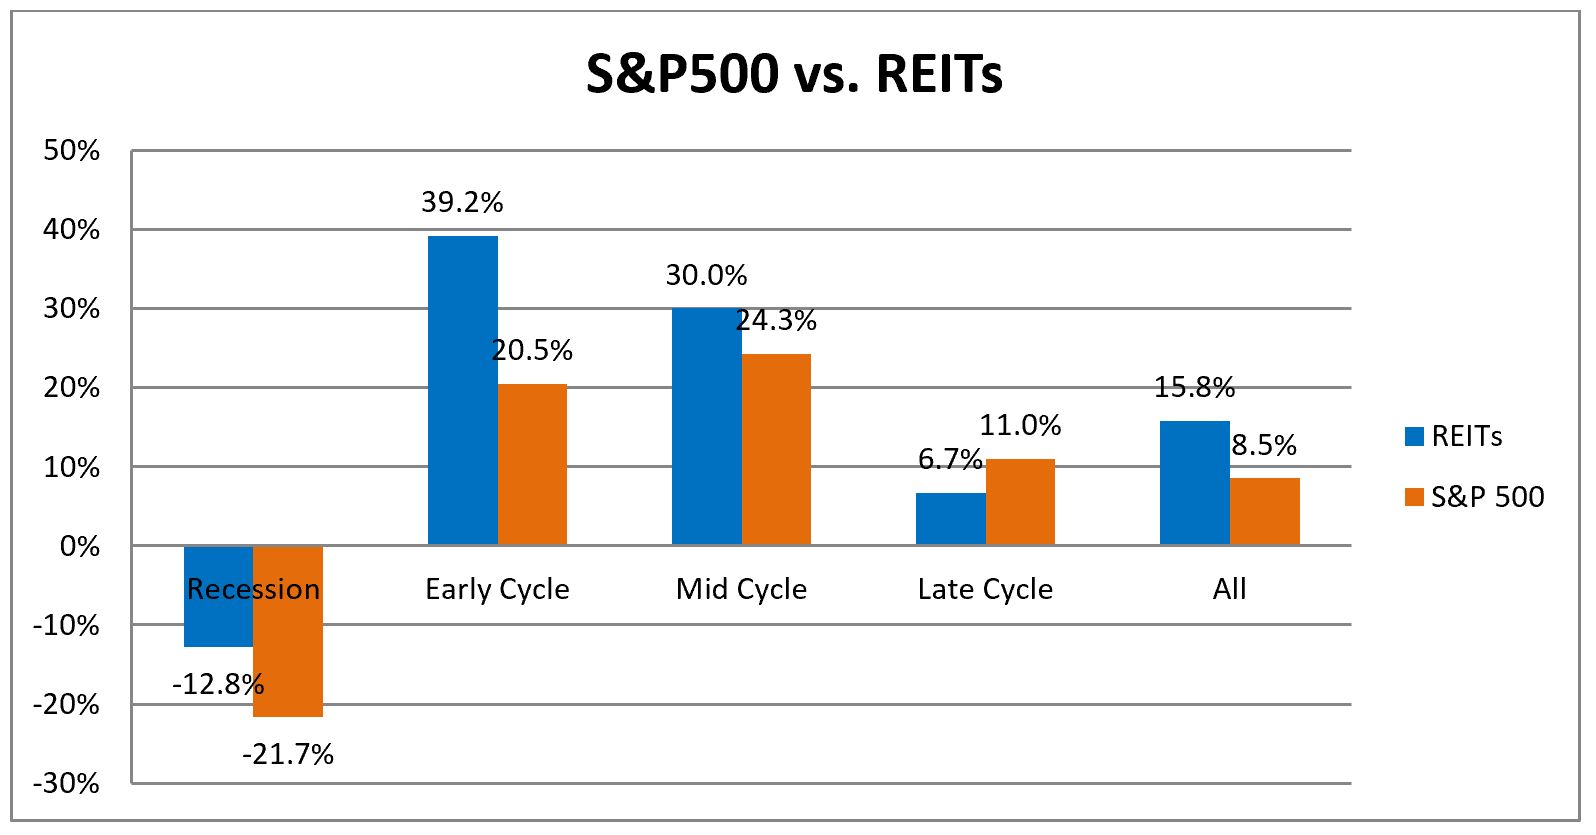
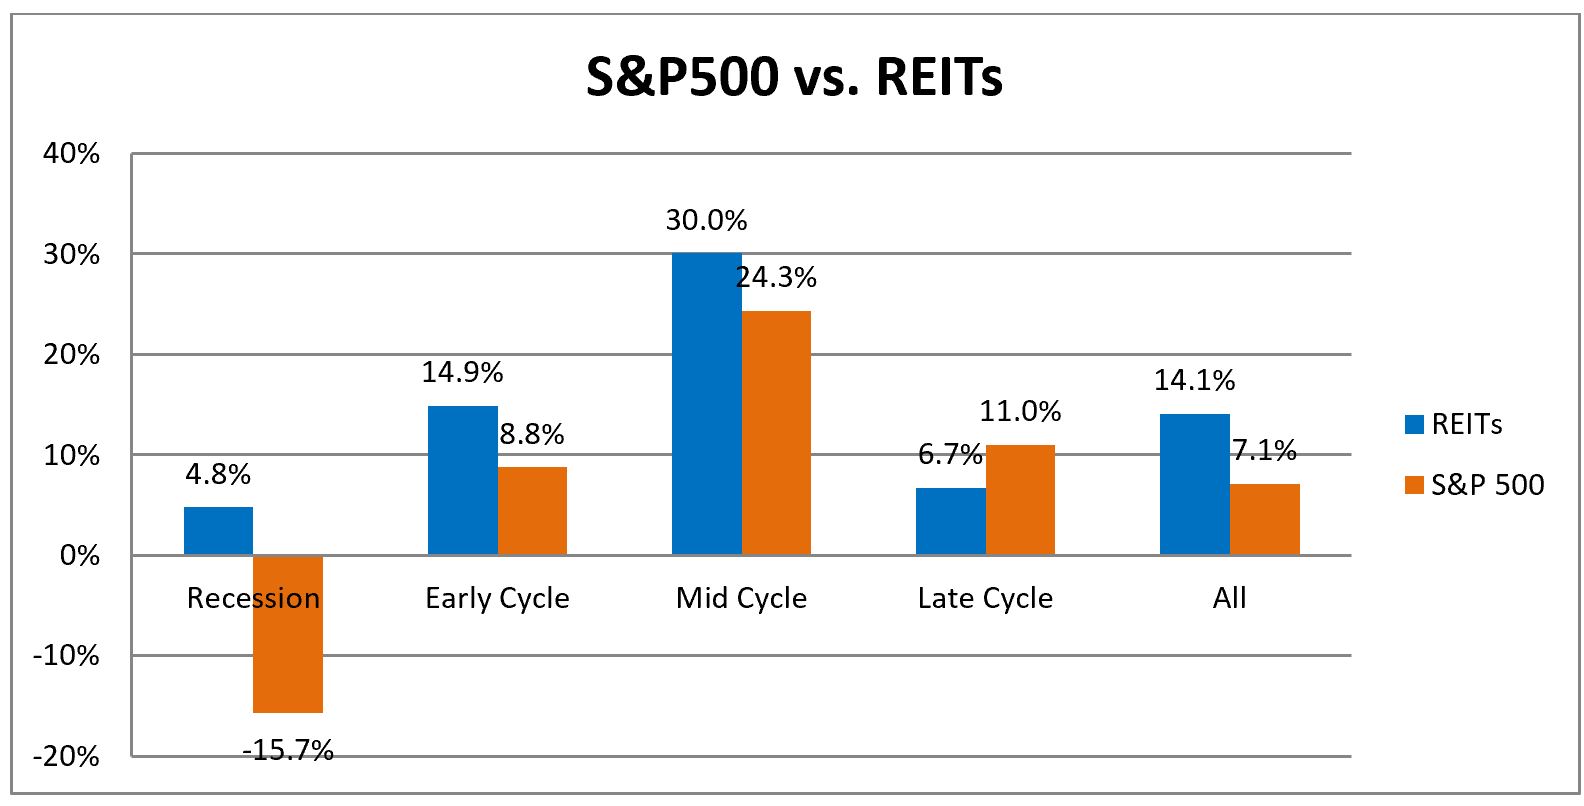
Business Cycle Assumption 1:
In this instance the original methodology described was used to determine the business cycle phases.
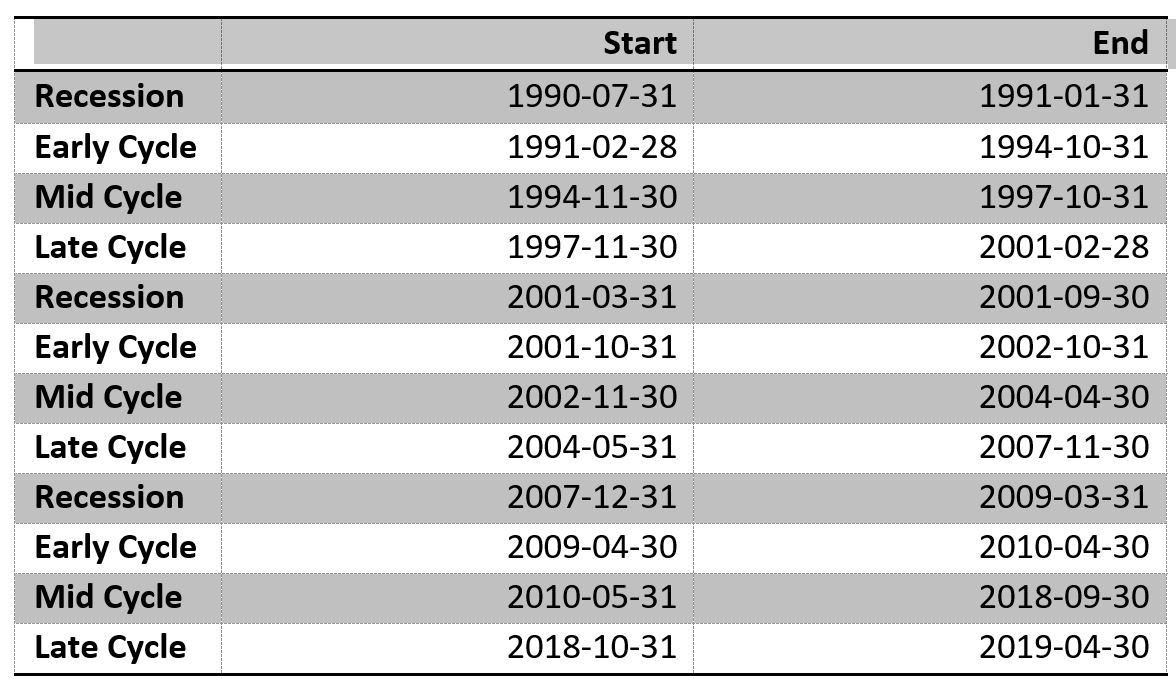
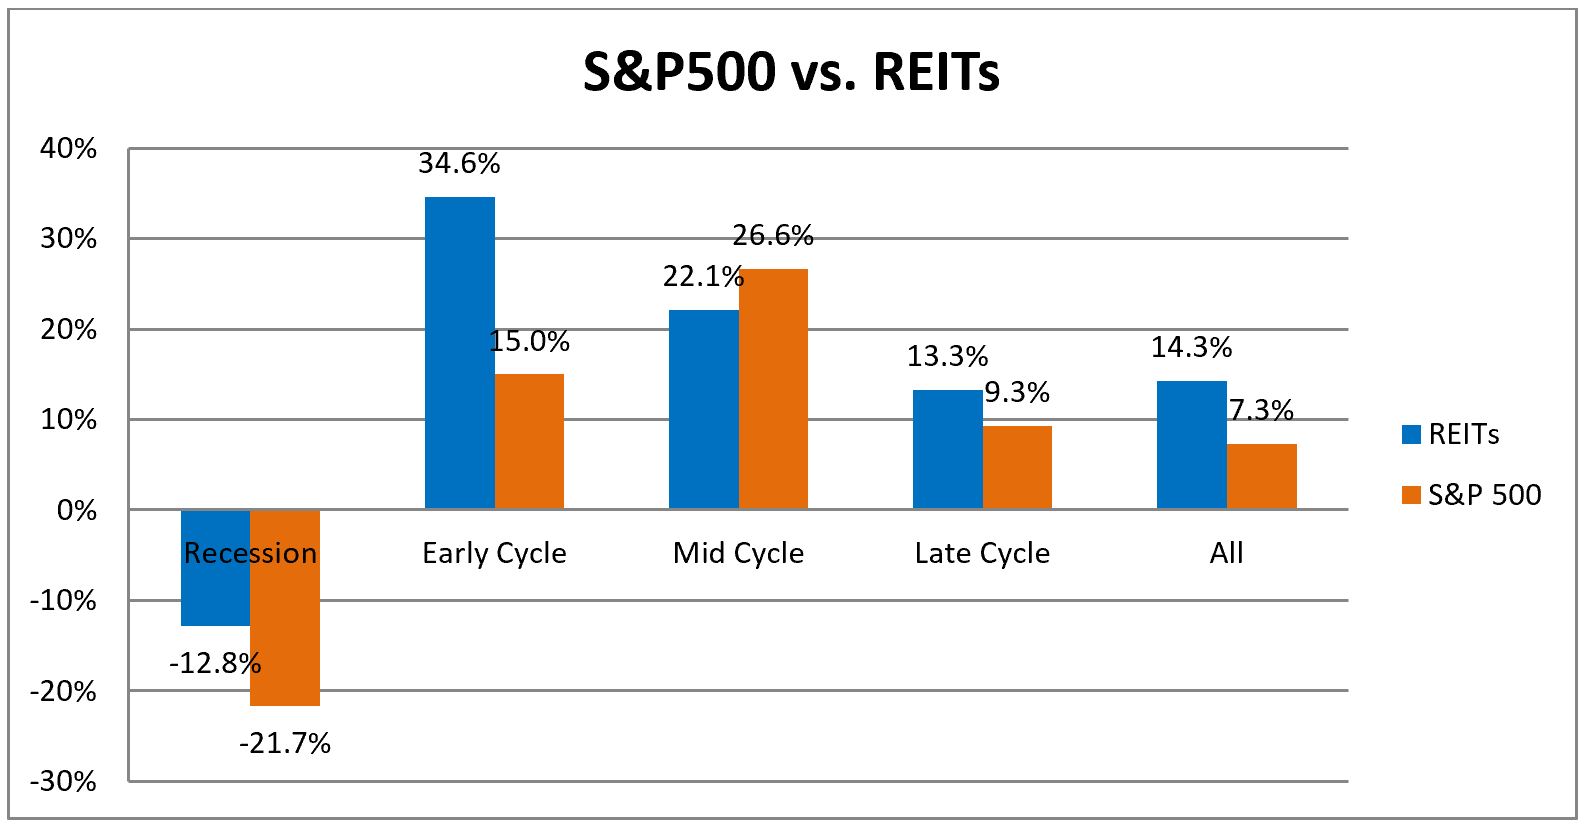
Results with 2008 financial crisis and recovery:
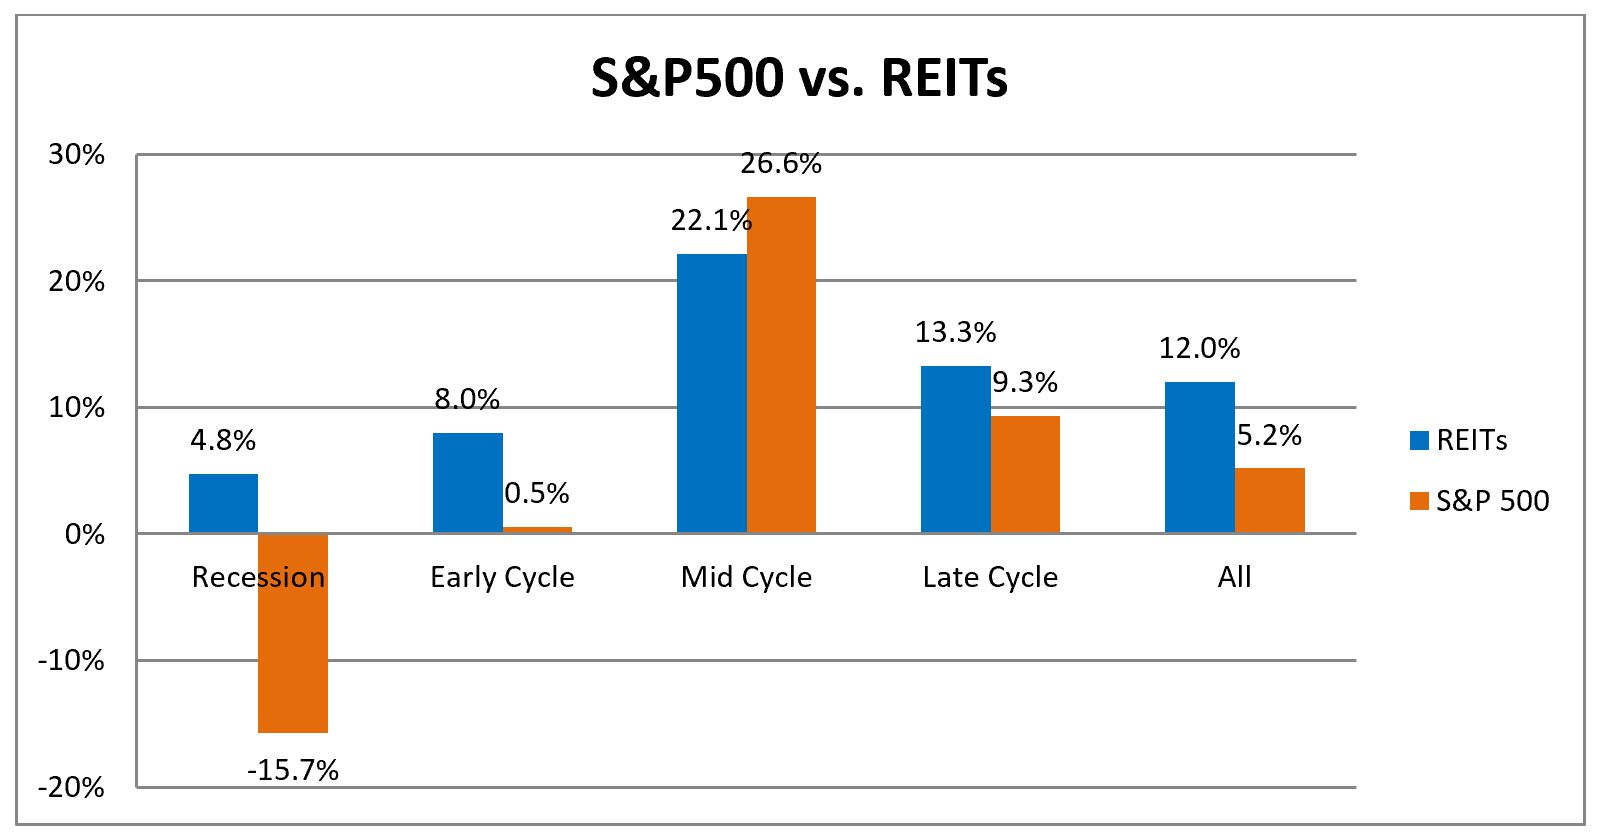
Results without 2008 financial crisis and recovery:
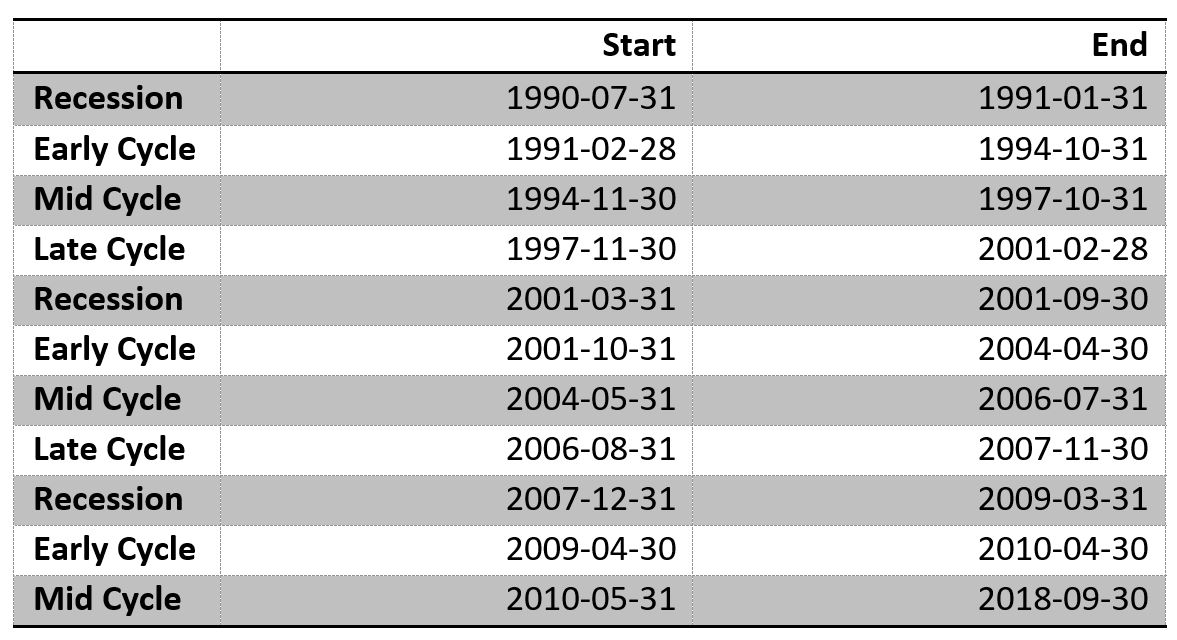
Business Cycle Assumptions 2:
In this instance the methodology for designating business cycle phases in the 2001 to 2009 period is altered, due to the original yielding an abnormally long Late Cycle. Here, the Early Cycle of that period is prolonged to the end of the Mid Cycle from the previous method of designation. This is supported by the fact that besides a roughly one-year slowdown in the CBLEI rate of change, following it, the growth rate retraces to very high levels that are usually accepted as a synonym of the Early Cycle.
Results with 2008 financial crisis and recovery:
Results without 2008 financial crisis and recovery:
Interpreting the 2 different business cycle assumptions:
It is hard to determine which business cycle phase assumption is more accurate, as both have fundamental support. One point of view, which accepts that the late cycle is the final squeeze of the economy before the coming of a recession, gives more validity to the shorter denomination of the late cycle in assumption 2. However, assumption 1 also finds it support, as in its prolonged late cycle economic outlook seems to be constantly deterring and therefore signaling the tightening of the economy which the late cycle is known for.
Ultimately, the choice of which assumption to be steered by could depend on the desired goals for the analysis. For example, assumption 1 is better suited for analyzing early cycle returns in the immediate after-math of recessions, and hence better suited for use when deciding on portfolio allocations in such periods. While assumption 2 gives a possibly more accurate view of expected returns from the 2 expected indices when the economy is at its tipping point, and a recession could take place anywhere in the coming months. Hence, when approaching the 2 models, the reader should ask themselves about the purpose with which they want to analyze the results and based on that refer to the model with assumptions that will lead them to more meaningful takeaways.
Furthermore, both assumptions yield business cycle phases that roughly correspond to the US GDP graphed in green, hence there’s no clear winner as to which one is more accurate in that sense.
Business Cycles and REITs
In the next article, we will look at some investing strategies for REITs and how to evaluate the above data.


1 Comment
Edmonton Realtor · 25 July 2023 at 14:56
In times of economic uncertainty or market downturns, the liquidity of REITs can provide an advantage, allowing investors to easily buy or sell shares without the challenges of selling physical properties.