Who – The state as a market participant
While traders on the stock market are usually seeking profit, the Chinese government can participate to limit other investors’ losses. After a month-long market crash in 2015, amplified by excessive margin lending and forced liquidations, the Chinese government intervened by purchasing and accumulating 4.3% of the total market value of domestic listed companies in an effort to stabilise the market. This in turn led to a decrease in stock price volatility and supported the overall market. The Chinese government’s unusually active role in markets can be partly explained by the market’s history of high volatility due to high turnover and substantial retail investor participation, which has contributed to speculative, sentiment-driven trading. Moreover, China’s ongoing property downturn, deflationary pressures and subdued domestic consumption make market stabilisation particularly important, as further equity-market instability could undermine investor confidence and exacerbate existing economic challenges.
Beijing has therefore taken an active approach to stabilise the market which is primarily concentrated in the Shanghai and Shenzhen stock exchanges and encompasses companies across a broad range of industries, with significant representation from banking, industrials, consumer goods and technology. Beyond regulatory measures such as IPO suspensions, Beijing has established a “National Team”, a network of state-backed financial institutions that intervene directly in equity markets, primarily through stock and ETF purchases. Its mandate is to stabilise prices, restore investor confidence and prevent disorderly market declines. The principal actor today is Central Huijin Investment, a subsidiary of the sovereign wealth fund China Investment Corporation (CIC), which controls key intervention vehicles, including Huijin Asset Management and, since 2025, China Securities Finance. Other state-backed institutions also participate in market interventions and the People’s Bank of China (PBoC) provides liquidity support when necessary. While Beijing began purchasing company shares in the 2008 crisis to support banks, the 2015 crisis marked a turning point in large-scale direct intervention and since 2023 we have entered the modern era of state-backed intervention which is mostly ETF-based.
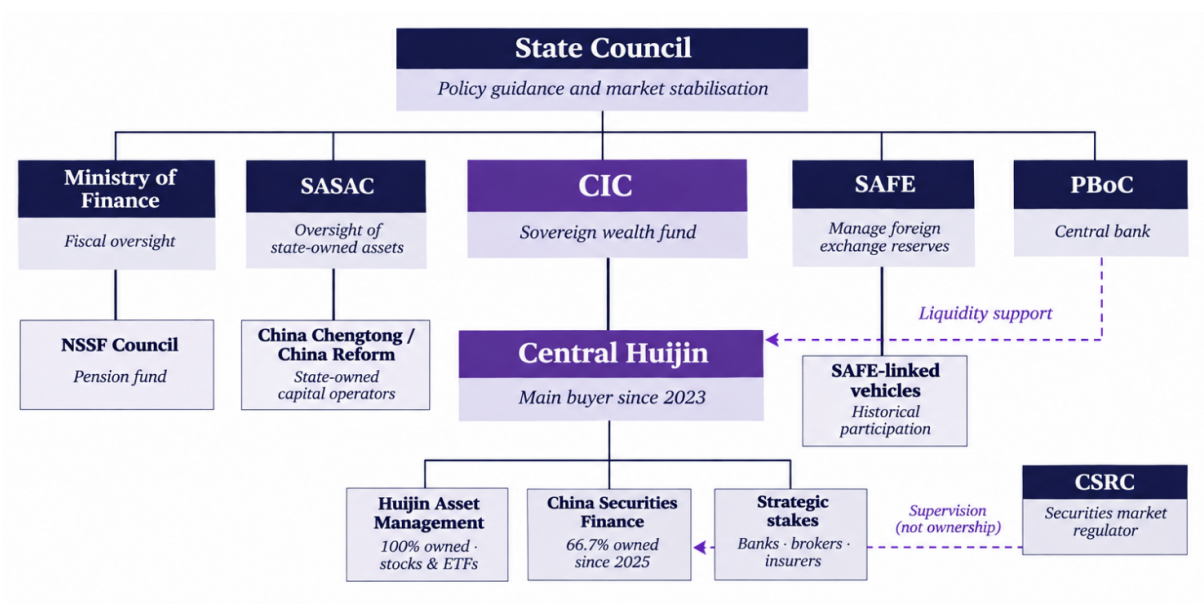
Beijing- backed firms are not classic profit-maximising agents but rather stabilisation agents. Beyond their short-term objectives, they also aim to enforce a more controlled market trajectory. By reducing volatility in equity markets, the National Team aims to prevent disorderly selloffs but also discourage speculative rallies.
How – The mechanics of intervention
In an intervention, the National Team buys or sells shares and ETFs through the previously discussed state-backed financial institutions such as Central Huijin. The exact decision-making process is not publicly explained and the amounts deployed are not always disclosed, making it difficult for investors to identify and analyse interventions in real-time. The scale of intervention appears to be discretionary, depending on market conditions and the government’s stabilisation objectives.
During an intervention the National Team will often favour intervention through ETFs over individual stocks and through large caps over small caps. UBS indeed found that 76% of National Team ETF purchases in early 2024 went into CSI 300 funds and the remainder was directed towards smaller-cap indices. Although no reason is publicly given as to why intervention is done in this way it can be supposed that they prefer ETFs for the speed and scale at which they can offer a market-wide support that will boost investor confidence. As for their preference for large cap, it can possibly be attributed to the fact that these offer greater liquidity while allowing the defence of systematically important companies that are pillars of the economy.
Another notable feature of National Team interventions is that they are often concentrated towards the end of the day. During the 2015 market crash, Reuters found that most of the suspected state purchases it examined occurred in the final 30 minutes of trading, while a similar surge in ETF trading volumes was observed in the final hour on 23 October 2023, when Central Huijin is confirmed to have traded. One possible hypothesis as to why is that late buying helps support closing index levels and forces short sellers to cover their positions which in turns reinforces the intended effect. Beyond the immediate effects, intervening near the close could also serve a psychological purpose as a last-minute recovery could leave investors with a better impression of the market for that day. Another hypothesis is that repeated late-day interventions could discourage some speculative trading earlier, as traders anticipate the possibility of government purchases before the close. However, some of this trading concentration may simply reflect greater institutional liquidity towards the end of the day which makes it difficult to establish the government’s exact intentions.
The National Team is also selective about which trades it does and does not disclose. Indeed, while some are confirmed, most likely in the aim to restore investor confidence and amplify their impact, others never are. One possible explanation is that keeping the size and timing of interventions uncertain makes it harder for traders to anticipate government activity and trade ahead. This uncertainty could also discourage speculative selling, as investors know that the government might intervene at any moment, even without an announcement. In this sense, the possibility of intervention could influence market behaviour even when the National Team is not actively trading.
While the interventions have clearly established short-term benefits for the Chinese equity market, their longer-term effects are uncertain. The Chinese government-backed trading can indeed help prevent a wide scale financial crisis and the risk of contagion across financial markets. This allows more time for policymakers to address other pressing economic challenges in the country. However, research by Stanford University found that government purchases during the 2015 weakened price informativeness, as investors increasingly focused on government activity rather than company fundamentals. This could lead to a misallocation of capital, as stock prices become less reflective of companies’ actual prospects and of speculation around how willing the government is to support them. Moreover, repeated intervention risks encouraging investors to take excessive risks under the assumption that the government will protect them from significant losses. It could also create a dependence on state support, making it tougher for authorities to withdraw without triggering selling pressure. Most importantly, supporting stock prices does not resolve China’s underlying economic problems and if the government attempts to maintain valuations disconnected to economic fundamentals, it may simply delay the necessary market adjustment rather than prevent it.
Flows – Detecting the invisible buyer
A natural question is: how can we track National Team interventions? The team does not always announce its purchases, and ETF holder disclosures appear only twice a year, leaving no complete daily record of its activity. We therefore rely on two main measures. The first, and most useful, is net ETF creations, which show when an unusually large number of new fund units are issued. The second is daily excess turnover, which shows when trading rises well above its usual level. Together, they allow us to make informed judgments about when intervention is likely. When holder disclosures arrive, we can check whether National Team holdings increased over the period and assess whether our interpretation was right.
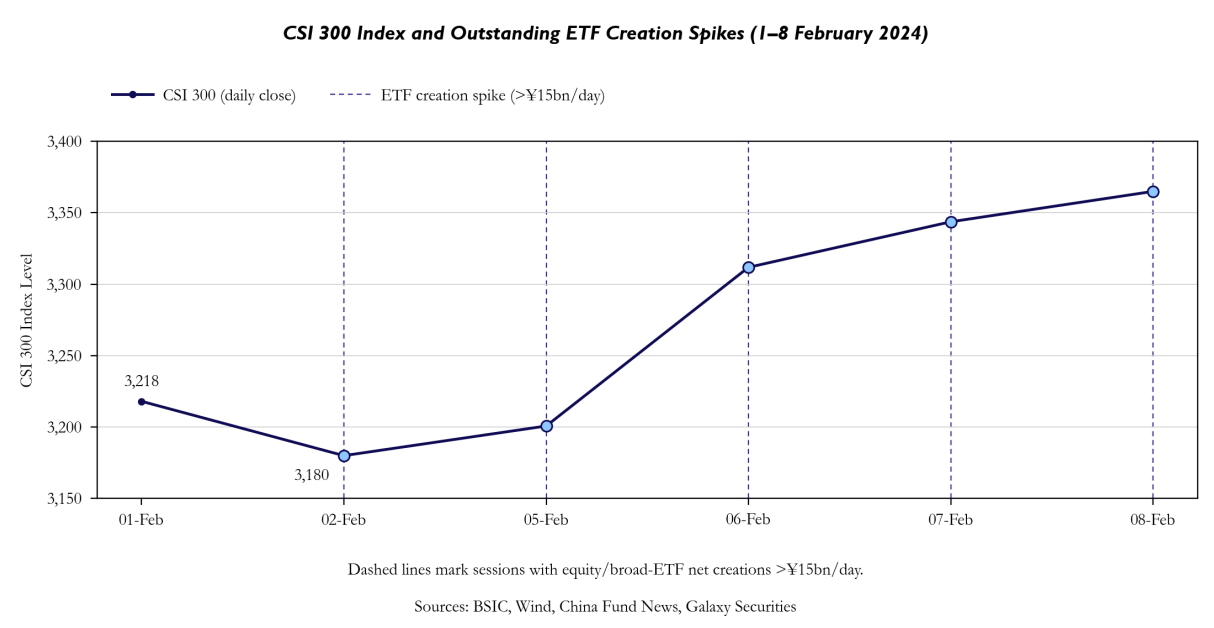
Net ETF creations give us a way to measure unusually large increases in demand for a fund. We calculate them by taking the change in the ETF’s outstanding units from one day to the next and multiplying it by its closing price. Across the broad-market ETFs we track, the value of units created or redeemed on a typical day is around ±¥3.5bn. On 7 February 2024, the Huatai-PineBridge CSI 300 ETF alone added approximately 2.06bn units. At a closing price of ¥3.34, those new units were worth about ¥6.9bn, roughly twice the typical daily change across all the funds we track. A creation of that size during market stress is a useful clue that a large buyer may be providing support, especially when later disclosures show that Huijin built a substantial position in the fund. The main limitation is that this calculation captures new units, not all purchases. Huijin can buy ETF units that another investor already owns. That changes who holds the fund without changing its total units, so net creations would record nothing. Redemptions by other investors can also offset creations and make the net figure smaller than the buying taking place. A large spike may therefore help us spot an intervention, but a small figure cannot rule one out or tell us Huijin’s total spending.
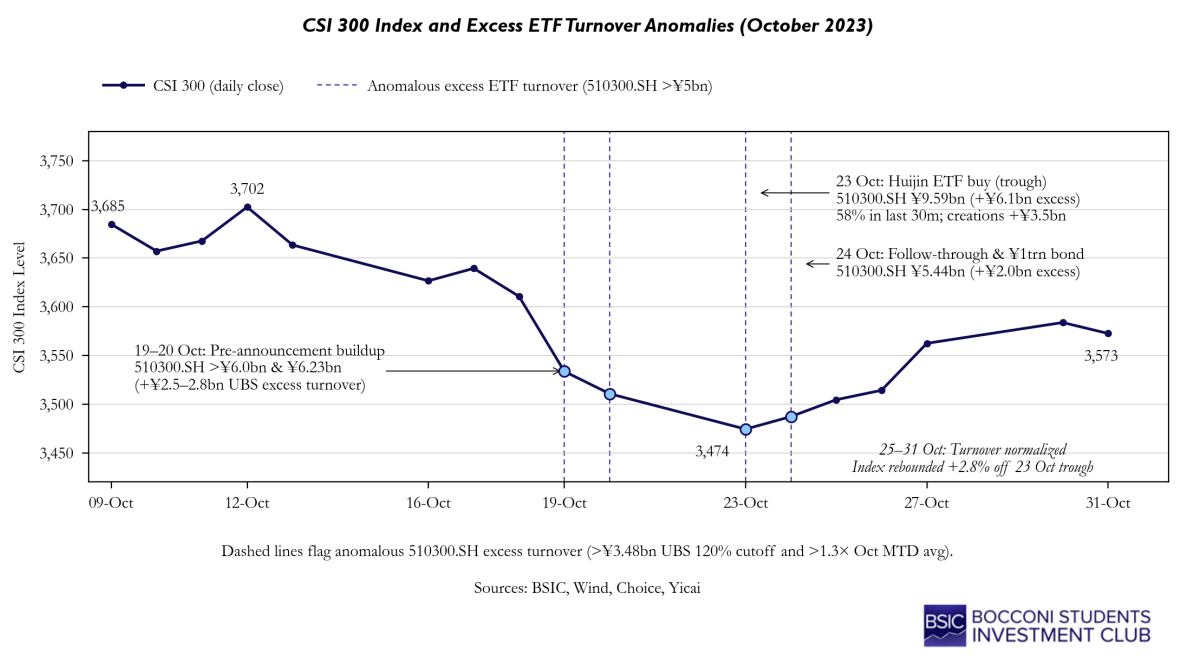
Net creations cannot capture purchases of ETF units that already exist. Excess turnover helps us look for the trading those purchases might leave behind. Following the calculation in our research, we take each ETF’s daily trading value and subtract 120% of its average daily trading value in 2023; if the result is negative, we record zero. For example, if an ETF normally trades ¥3bn a day but trades ¥10bn today, its excess turnover is ¥10bn − (1.2 × ¥3bn) = ¥6.4bn. Our second check compares the combined turnover of four major ETFs with its median over the previous 20 trading days. That tells us how unusual the activity is relative to recent trading, rather than a fixed 2023 benchmark. On its own, a turnover spike tells us where to investigate. We can then ask whether trading was concentrated near the close, when our research has found some of the clearest unusual activity. Net creations make the interpretation stronger: if both measures surge during a market sell-off, we see unusually heavy trading and a large increase in ETF units. If turnover surges while creations remain modest, purchases of existing units become a possibility. On 23 October 2023, for instance, the Huatai-PineBridge CSI 300 ETF traded ¥9.6bn, with ¥5.6bn in the final half-hour, while its net creations were worth ¥3.5bn. Turnover draws our attention to activity that the creation figure alone does not describe. Its limit is attribution. Turnover measures trading, not who bought, who sold, or how much either side accumulated. A spike could reflect panic selling, private investors trading among themselves, or other large institutions. Even the gap between turnover and creations cannot be assigned to Huijin. We use excess turnover to reinforce or question the signal from net creations, not to calculate the National Team’s purchases.
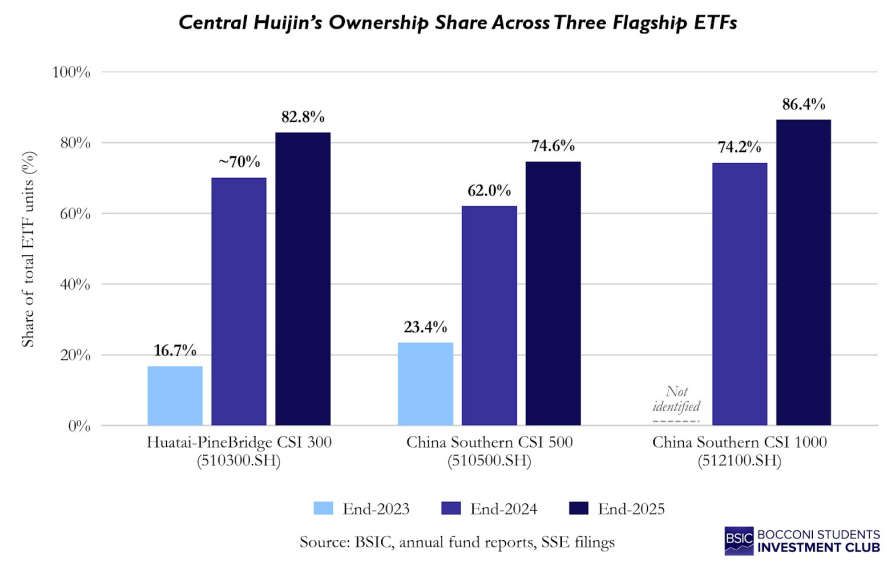
Our final check comes from the ETFs fund managers. Their midyear and annual reports show how many units are held by institutions and individual investors. Annual reports also name the largest holders, allowing us to count units held directly by Central Huijin and Central Huijin Asset Management and divide that total by the ETF’s outstanding units. We can then compare those holdings with the creation spikes we flagged during the preceding period. If Huijin’s position grew substantially, that supports our interpretation of the flows, although the report cannot tell us which day it bought. The change was substantial. In the Huatai-PineBridge CSI 300 ETF, Huijin’s disclosed share rose from 16.7% at end-2023 to about 70% at end-2024 and 82.8% at end-2025. In the China Southern CSI 500 ETF, it rose from 23.4% to 62.0% and then 74.6%. Huijin was not identified among the largest holders of the China Southern CSI 1000 ETF at end-2023 but held 74.2% at end-2024 and 86.4% at end-2025. These are ownership shares of individual ETFs, not of the indices or their constituent stocks. The pattern supports our reading that buying began with large-cap funds and subsequently broadened to smaller-cap funds.
H1 2026 gives us strong evidence that Huijin reduced its position in a major CSI 300 ETF, but the story does not end there. The Huatai-PineBridge CSI 300 ETF’s 2025 annual report names 73.51bn units held by two Huijin entities. Its June 2026 report does not name the largest holders but shows that all institutions combined held only 11.66bn units. Huijin therefore held at least 61.85bn fewer units in this ETF than at end-2025. The reports do not show their exact June position or the dates of the transactions. State-backed support reappeared in July. China Chengtong said it had recently bought nearly ¥10bn of Chinese stocks and planned further stock and ETF purchases. China Reform Holdings also said it had deployed funds to support the market and would continue buying state-owned company shares. Meanwhile, broad ETFs recorded substantial inflows. These observations support the case for renewed National Team activity, but they do not establish whether Huijin bought any of the new ETF units. Later named disclosures may show whether Huijin rebuilt its ETF positions, though they will not identify which daily inflows it purchased.
2024 – A natural experiment
2024 was the year Central Huijin became the dominant holder of the flagship ETFs it used to support Chinese equities. At the end of 2023, it owned roughly one-fifth to one-quarter of each of the four largest CSI 300 ETFs; by the end of 2024, those stakes had risen to 70–82%. Its purchases also expanded beyond large caps into CSI 500 and CSI 1000 ETFs, with a brief surge in CSI 2000 funds during February’s small-cap crash. The year’s two defining episodes were that February rescue and the surge in ETF creations around September’s policy announcements, followed by substantial redemptions in October and November.
China entered 2024 with investor confidence already weakened by the property downturn and sluggish demand. Property development investment had fallen 9.6% in 2023, and January’s manufacturing PMI stood at 49.2. In this fragile market, selling pressure became concentrated in smaller stocks. Many quant funds had built similar positions in small and micro-cap shares after those stocks outperformed larger companies in 2023. Some held baskets of small stocks while shorting CSI 500 or CSI 1000 futures as a hedge; leveraged DMA versions magnified their losses. As the indices fell, snowball products linked to them breached preset thresholds, prompting dealers to unwind futures hedges and adding to the market pressure. Falling small-stock prices then pushed some quant funds to reduce leverage by selling their holdings. Those sales drove prices down further in shares where buyers were already scarce. The resulting losses encouraged some quant funds to reduce leverage and sell their small-stock holdings. Because many funds held similar positions in relatively illiquid shares, their sales could push prices down further and prompt more selling. The hedge did not necessarily protect them: when index constituents began recovering while micro-caps remained weak, funds holding the latter and shorting index futures could lose on both sides of the trade. Quant funds therefore amplified the crash.
Huijin’s initial ETF footprint was concentrated in large caps. From 15 January to 2 February, the four largest CSI 300 ETFs recorded approximately ¥142bn of net share creations, while CSI 1000 ETFs saw little comparable demand. The split became stark on 5 February: the CSI 300 rose 0.65%, but the CSI 1000 fell 6.16% and roughly 92% of stocks declined. That day, net creations reached approximately ¥14.1bn in the largest CSI 500 ETF and ¥7.7bn in the largest CSI 1000 ETF. On 6 February, Huijin announced that it had already expanded the range of ETFs it was buying and would increase its purchases. The four largest CSI 300 funds still recorded another ¥30.9bn of creations on 7 February; by 8 February, two CSI 2000 funds had recorded approximately ¥6.2bn. The immediate slide was arrested: between the close on 2 February and the final pre-holiday session on 8 February, the CSI 500 gained 12.9% and the CSI 1000 gained 7.0%. The timing of the creations, together with Huijin’s statement, makes a strong case that support broadened as the small-cap crisis intensified.
September 2024 was a turning point for the policymaker. Earlier rounds of intervention focused on “stabilization”, i.e. limiting the systemic risk arising from liquidity spirals. The policies implemented in September 2024, coupled with some National Team buying, had the aim of addressing the generally weak economic momentum that China was experiencing, together with the property downturn.
National Team purchases were coupled with a series of measures:
- The introduction of a ¥500bn swap facility for asset managers, through which they could exchange eligible liquid assets for government bonds and central bank bills, which they would in turn use to raise financing for equity purchases.
- The introduction of a ¥300bn buyback relending facility for a group of 21 large banks. Anytime a corporate wanted to undertake a share buyback, it could ask one of these 21 banks for funding – which in turn the banks could acquire from the PBoC at a fixed rate. In essence, it was a facility to support share buybacks.
- A 50-basis-point cut in the reserve requirement ratio for banks (freeing up approx. ¥1tn of liquidity) and a 20bp cut in the policy rate.
- A verbal commitment to provide additional policy support via fiscal channels, later followed by an ¥8tn refinancing package for local government debt, which helped limit spending cuts and gave breathing room to local governments under repayment pressures.
Announcements of the above policies were made starting 24 September 2024 and ratified by 30 September for what concerns the follow-ups. The market response saw a +25.1% rally in the CSI 300 (+27.7% in the CSI 1000) between 23 September – 30 September, and option smiles becoming extremely bid-for-calls. This is an important event to keep in mind for the discussion on trade ideas: we can’t expect another round of measures like these for the purpose of the trade idea, and it’s worth remembering that the measures were undertaken in extreme circumstances like those of 2024.
The trade(s): how do we position for intervention?
To position for intervention, we consider a couple of trades in options. While it may be simple to just set up a long position in one of the indices (or a long-short position in two indices), other expressions in vol may be a complementary risk exposure to the trade in delta.
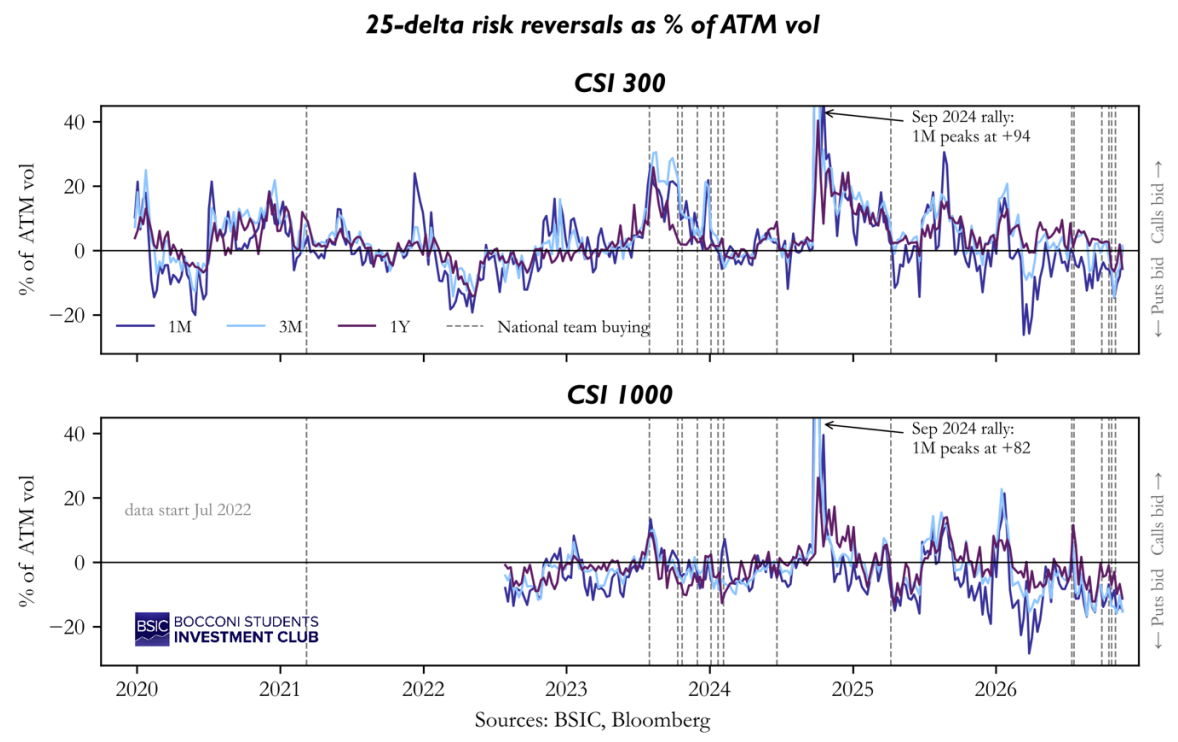
The first trade we discuss is in skew. Looking at past intervention episodes, we noticed that topside risk reversals in both the CSI 1000 and the CSI 300 performed well, especially in bid-for-puts environments. While this is not strictly because of intervention news, but also supported by mean reversion in skew levels, it may be an interesting addition to the trade in delta. The one exception where the trade went spectacularly wrong was the intervention following Liberation Day, during which skew became extremely bid for puts. This is a good example of how a broad selloff can outweigh the impact of government intervention.
The constant-maturity IV series we use are from Bloomberg and come from a volatility surface that is interpolated from both listed options and OTC trades. The currently available longest-expiry options on both indices expire in September 2027, which is not exactly a 1y expiry but rather a 10-month one. The valuation argument still stands and we think it could be a reasonable implementation of the view.
If we look at 25-delta risk reversal IVs on both indices (adjusted for the difference in ATM vol levels) we see that CSI 1000 topside risk reversals are currently trading at a historically low level compared to the same structures in CSI 300. Relative to ATM vol, CSI 1000 risk reversals sit in the bottom 10% of their history since mid-2022 at all three tenors (1m, 3m and 1y), and the 3m and 1y are also in the bottom 3% of the past year. CSI 300 1m and 3m risk reversals, by contrast, are close to their median, while the 1y is at a record low on both measures (Table 1). To check whether this simply reflects a broader move in Asian equity skew, we use the HSI as a control, since the National Team does not intervene there. Only the 1y looks cheap relative to the past year (4th percentile), which suggests that part of the recent cheapening in 1y skew is market-wide, while the extreme readings relative to longer history are specific to the mainland indices.
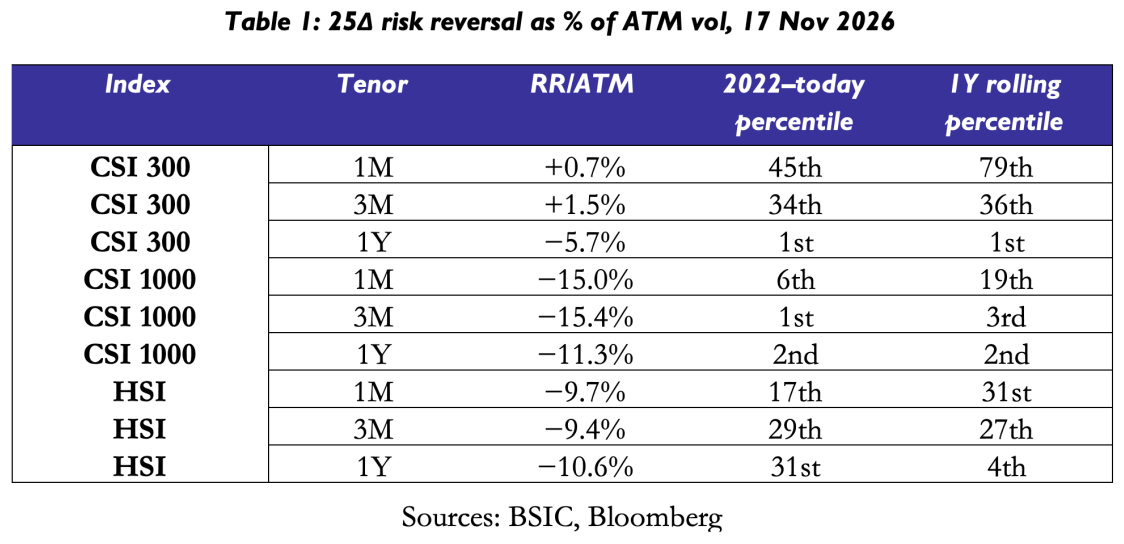
A likely cause of the valuation difference between CSI 1000 and CSI 300 may be the belief that a potential episode of government intervention will not support small caps, if were to occur now. Choosing to trade the structure on CSI 1000 requires a view on this debate. We can’t help but flag the potential for more value to be found in CSI 1000, and the fact that there are historical precedents in which the National Team intervened in small caps.
For what concerns the choice of expiry, despite the longer tenors provide more attractive entry points from a historical standpoint, it’s worth noting that there have been episodes (e.g. October 2023, February 2024) in which intervention was read as a very temporary effect and skew only repriced in the shorter tenors. Besides the trade-off in valuation (at least for structures on the CSI 300) we also have to consider that shorter-dated structures will gain more gamma as the spot moves away from the current level, and as we’re only expressing a view on implied vol (rather than realized vol versus implied vol) it may be undesirable, especially if the current drawdown extends further.
If we had to express a preference, we would probably lean for buying topside risk reversals on the CSI 1000, with a choice to be made on whether to trade 3m or 1y. Although we looked at the trade from a vega point of view, one may leave the delta exposure unhedged, if the aim is to have the vol view as complementary to the spot view. To cap the losses on the put side of the trade, one may consider trading a put spread on the put leg.
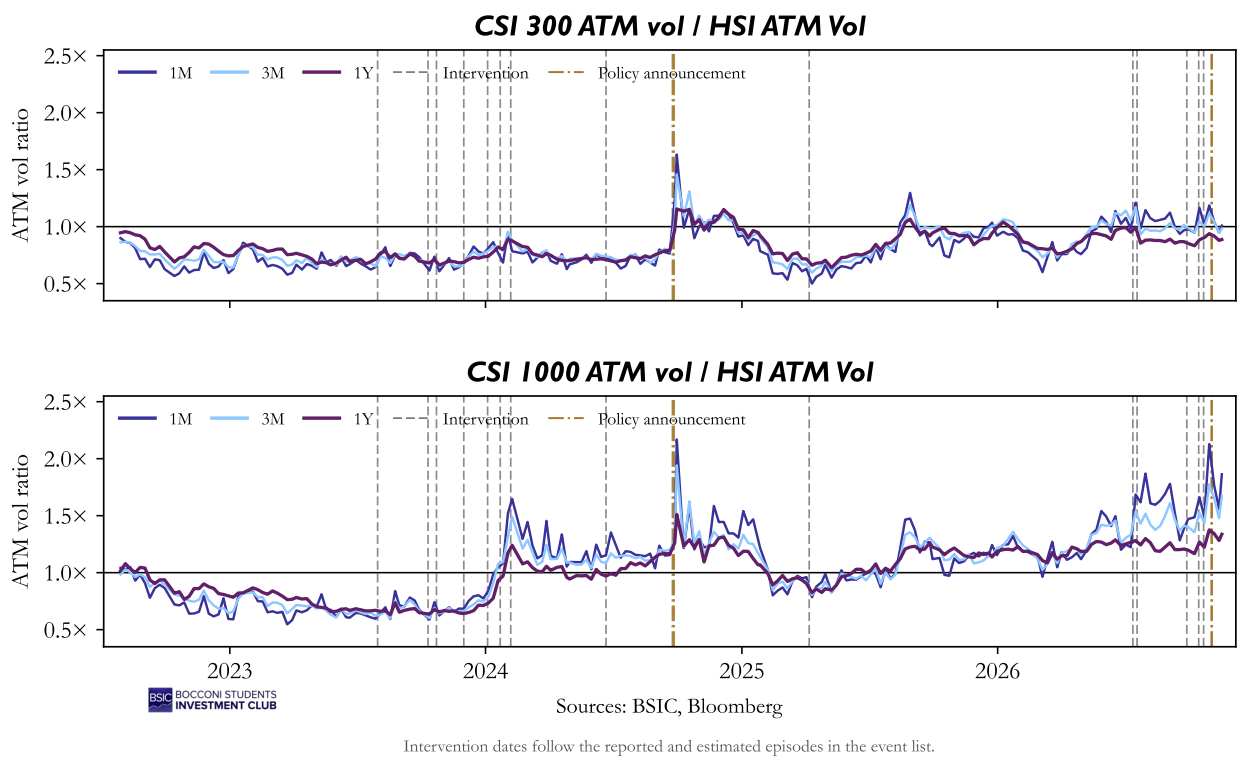
Another trade we considered is a cross-market vol trade. Since the government does not intervene in equities listed in Hong Kong (belonging to the Hang Seng index), we thought it could make sense to buy straddles on one of the mainland indices and sell straddles on the HSI. The historical data paints a mixed picture on how effective this expression would be. In the latest intervention rounds, mainland vols richened to HSI vol around intervention dates. However, there are several episodes in the past in which the moves were small and perhaps not worth betting on.
A key risk of the trade is that any intervention happening soon could be much more targeted than past rounds. For example, since the current drawdown is concentrated in tech stocks, and since the tone of the regulator has shifted towards intervention being the tool to ensure access to stable funding for corporates leading economic development, it could be that the government prioritizes intervening in sector ETFs.
References
- UBS. “China Equity Strategy: How to Track and Quantify ‘National Team’ Inflows?” 27 February 2024.
- Goldman Sachs. “China Musings—Navigating 2025, Part I: Lessons from Chinese Equities in 2024.” 6 January 2025.
- Ping An Securities. “Developments in the Fund Industry through the Lens of Market Participants’ Capital Flows.” 12 February 2025.
- Soochow Securities. “‘National Team’ ETF Holdings and Capital Flows—Capital Flows and Short- to Medium-Term Indicators, No. 12.” 15 April 2025.
- Guosen Securities. “Three Perspectives on Market Stabilisation Funds.” 5 February 2026.
- China International Capital Corporation (CICC). “A-Share Strategy: Market Stabilisation Mechanisms, Part 3—The Power of Market Stabilisation.” 10 August 2026.
- Orient Securities. “Microstructure Observations, Part 4: ETF Trading Volumes Rise and Quantitative Signals Strengthen—Markets May Stabilise and Rebound.” 23 October 2026.
- Kaiyuan Securities. “Weekly Investment Strategy: Rebalancing Enters Its Second Stage; a Rebound Still Requires Confirmation.” 1 November 2026.
- Shanxi Securities. “Commentary on the Two Meetings of 2 November: Small Funds, Large Multipliers—How Institutionalised Market Stabilisation Tools Change the Valuation Denominator.” 3 November 2026.
- HSBC Qianhai Securities. “China Equity Strategy: Stabilisation Mechanisms Aim to Restore Market Confidence.” 3 November 2026.
- Stanford Center on China’s Economy and Institutions. “What Are the Costs and Benefits of China’s Domestic Stock Market Interventions?” Updated 15 August 2024. FSI
- Westbrook, Tom, and Summer Zhen. “Why China’s National Team Won’t Save Spiralling Markets.” Reuters, 5 February 2024. Atlantic Council
- Kowsmann, Patricia. “China Deploys a ‘National Team’ of Investors to Keep AI Stock Boom in Check.” The Wall Street Journal, 14 February 2026.



0 Comments