Understanding the U.S. Housing Market Slowdown
The U.S. housing market has slowed sharply, yet prices have refused to fall alongside it. Existing-home sales ran at an annualized pace of just 3.99m in September 2026, roughly 23% below the long-run average of about 5.2m and close to a 30-year low. Even after adjusting for seasonal patterns, August and September were the two weakest months of the year. The cause of the slowdown is borrowing costs, which have been climbing for most of the year. The average 30-year mortgage rate stood at 7.24% at the end of October, up from 6.17% a year earlier and 5.98% in February. At the same time, inventory rose to 1.60m in September, its highest level since late 2019, and at the current pace it would take 4.8 months to sell it all, up from 4.5 months a year earlier. More properties are on the market but fewer are being bought, meaning buyers are the constraint rather than supply. Despite this, the median existing home sold for $417,500 in September, increasing 1.3% year on year and marking the 39th consecutive month of annual price gains. If buyers have stepped back and inventory is accumulating, why are sellers not cutting prices?
Most sellers are not cutting prices because they do not need to. Nearly half of all outstanding mortgages in the U.S. carry rates below 4%, with more than three quarters of U.S. mortgages carrying a rate beneath 6%. This puts the average rate on existing mortgages at 4.4%, almost 40% lower than the current 7.24% interest rate on new mortgages. This creates what is known as mortgage-rate lock-in: homeowners who secured cheap financing during the low-interest-rate period face a substantial increase in borrowing costs if they sell their property and purchase another using a new mortgage. The financial cost of moving therefore extends beyond the purchase price of the replacement home.
For the average U.S. borrower, who owes about $264,000, a 30-year mortgage at the average rate of 4.4% costs about $1,320 a month. At today’s 7.24% rate, it costs about $1,800, roughly 36% more every month for the same debt. Selling means giving that up. A low-rate mortgage is effectively an asset the owner loses by moving. This decreases the pressure on homeowners to sell, allowing them to hold out on their asking price and not need to adjust to fit the lower demand. Mortgage lock-in discourages homeowners from listing their properties, although inventory can still rise when sales decline faster than new listings. With many existing owners able to wait, the market adjusts through fewer transactions rather than an equivalent decline in prices. Lock-in is gradually weakening as older loans are repaid or replaced, with the share of mortgages below 4% decreasing from its 2022 high of over 65% to only 49% today. Nevertheless, this adjustment remains slow, and the majority of outstanding borrowers still benefit from financing rates below those currently available.
The national figures mask the split between sellers who can afford to wait and those who cannot. Builders typically need to sell homes quickly to recover their construction costs and pay off any loans they may have incurred to finance the project. Existing homeowners may also face financial pressure to sell, but those with affordable mortgages and no urgent need to move generally have greater flexibility. The contrast is particularly visible when comparing the housing markets of Austin and Hartford.
Hartford, Connecticut, is a clear example of a lock-in market, where only 22 out of the 1,043 monthly home sales in 2025 were new construction. This means about 98% of the sales are made up of existing homes, whose owners are likely to have more favorable mortgage rates than today’s. With little new building and few owners willing to give up cheap debt, active listings are 70% below their September 2019 level, homes sell in about a month, and prices rose 5% year on year in the first half of 2026.
Austin, Texas, is the opposite case: a builder market. In 2025, 789 of its roughly 2,479 monthly sales were new construction, so builders accounted for about a third of the market. Active listings are now 58% above their September 2019 level, homes take nearly three months to sell, and prices fell 2.4% year on year in the first half of 2026. Part of this decline reflects the unwinding of Austin’s larger pandemic boom, which left more room for prices to decline, but the scale of the supply build-up points to builders, who must keep selling regardless of conditions.
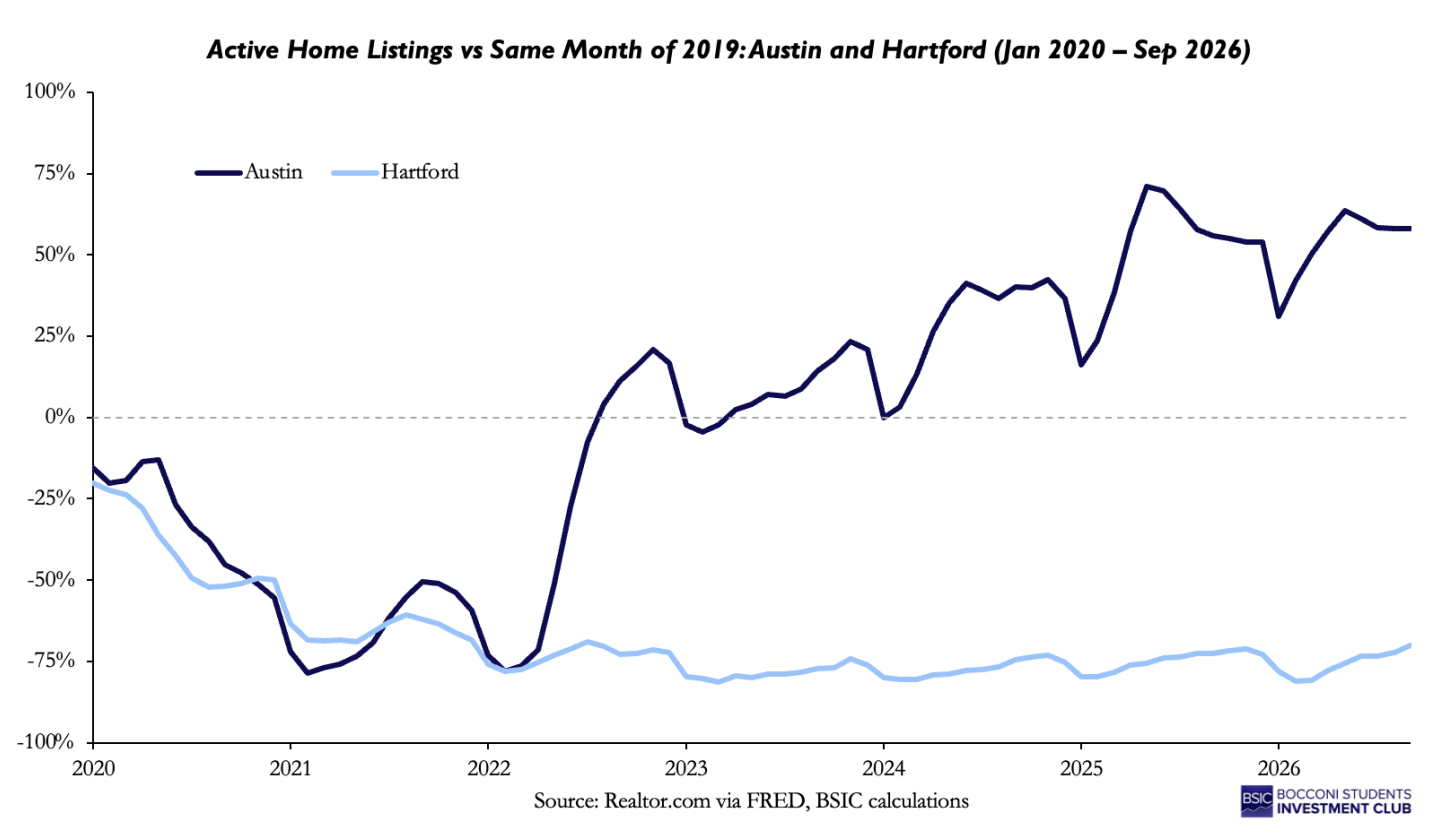
The divergence between Austin and Hartford is recent. Listings in both cities fell alongside each other during the pandemic, and remained fairly similar until early 2022. Once rates increased, however, the recovery in inventory followed different paths. Austin’s listings returned above their pre-pandemic level during 2022 and continued increasing, while Hartford’s remained substantially below it. Austin’s median price is only about 10% higher than Hartford’s, yet the two markets have moved in opposite directions, with listings up 58% in one and down 70% in the other. Where locked-in owners supply the market, prices hold; where builders supply a large share, prices give way.
This same pattern shows up across the US: while existing owners hold their prices, builders are cutting theirs. The median new home in the U.S. sold for $400,400 in September, down 3.9% year on year, while the median existing home rose 1.3% to $417,500. A year earlier, the median new home cost about $4,500 more than the median existing home. It now costs about $17,000 less. This inversion is surprising given that new homes usually sell at a premium, as they are more efficient, under warranty, and less likely to have pre-existing issues. New homes do tend to be smaller and further from city centres, which partly explains the gap, but a 4.1% discount shows how much builders have needed to lower prices.
Builders also face greater inventory pressure. At the end of September, the market for new single-family homes had 8.4 months of supply, compared with 4.8 months for existing homes. The two figures cover different housing segments, but the gap indicates that newly built properties face a considerably longer sales period relative to current demand. Builders’ returns depend on how quickly homes sell, not just the margin on each one, due to the tied-up capital and holding costs. For this reason, builders have been cutting prices rather than waiting. Completed, unsold new homes have decreased by roughly 13% since their peak in January, as builders have been working off finished inventory through price cuts and incentives such as mortgage-rate buydowns. All builders face the same pressures, but not all builders have responded in the same way.
When builders are under pressure to sell, they have two options: either cut prices and keep sales volume high, or keep high prices and accept selling fewer homes. It is a choice between overall volume and margin per home. Two of the largest builders in the US market, Lennar [NYSE: LEN] and D.R. Horton [NYSE: DHI], have adopted contrasting strategies. Lennar has chosen volume over margins, maintaining production while its gross margin fell to 15.8%. D.R. Horton has chosen margins over volume, cutting its new starts by 45% while holding its gross margin close to 20%. The comparison holds as both companies sell at almost the same average price, about $372,000 for Lennar and about $366,000 for Horton, with the margin gap reflecting a difference in strategy rather than product offering. The two firms have responded to these pressures in the market differently, particularly in how they balance sales volume, profitability, and the capital tied up in inventory.
Lennar [NYSE: LEN]: Prioritising Sales Volume
Lennar Corporation [NYSE: LEN] is a Miami-based homebuilder and one of the largest in the United States. It delivered 82,583 homes in fiscal year 2025 and 80,210 in 2024. Alongside D.R. Horton, it ranks among the country’s two largest builders by number of homes delivered. The company mainly targets first-time buyers, individuals moving to larger or more expensive homes, luxury buyers and active adults, with the majority of houses sold under the Lennar name. They also provide mortgages, title services and can help complete purchases. This mix of buyers matters for Lennar’s strategy: buyers who start with an entry-level home can trade up later, which gives Lennar a repeat-customer pipeline. However, it must be taken in consideration that first-time buyers are particularly affected by high prices and mortgage costs. Lennar operates in 26 states. Its South-Central region accounts for the largest share of home deliveries, at 28%, whereas the West generates 37% of the revenue due to the higher average selling price of $602,000. Texas and Florida are key markets as resales in those states have begun to increase, intensifying competition for buyers. Recent results have shown some pressure on sales: in the third quarter of 2026, new orders fell 9% from a year earlier to 20,879 homes, while deliveries fell 3% to 20,840. To encourage purchases, it continues to offer substantial incentives, such as reducing mortgage rates.
Lennar uses two tools to keep homes selling when buyers can’t afford a mortgage: price cuts and mortgage-rate buydowns. Both protect sales volume, but they affect profit. Price reductions are straightforward: Lennar lowers the price to attract buyers. In its fiscal 2025 annual report, Lennar stated that higher interest rates had made its homes less affordable, leading them to reduce prices and/or offer more incentives to maintain sales. Lower prices mean less revenue per home and, by lowering home values, this can lead to write-downs on land the company holds. With mortgage-rate buydowns there is a different process: Lennar pays to lower the buyer’s mortgage interest rate. This reduces the monthly payment without changing the list price and may help some buyers qualify for a loan. The company’s support is clear: its incentives are described as going toward buydowns and closing-cost help. One analysis estimated that Lennar was allocating around 14% of its sales price to mortgage rate burdens and closing cost assistance, indicating that these offers help buyers but come at a cost for Lennar.
The scale of the problem is shown in management’s comment: CEO Stuart Miller said that almost 50% of their visitors don’t immediately qualify for a loan. This suggests that Lennar must use financing incentives to convert a substantial share of prospective buyers into completed sales.
The cost of these offers remains high: in the third quarter of 2026, incentives in delivered homes were 12.0%, down from 12.9% in Q2 and 14.1% in the first quarter of 2026. Even though this can be taken as a sign that incentives are falling, and so buyers don’t require them as much, they are well above the company’s normal range of 4% to 6%, continuing to put pressure on profit per home. Competition adds to this pressure, as more existing homes are being offered for sale in Texas and Florida, two very important markets for Lennar. This is making it harder for Lennar to hit expected volume, as buyers have more choices and would require certain incentives to choose Lennar. The question is whether the benefits of keeping homes selling outweigh the cost of these offers. Both price cuts and mortgage-rate buydowns help sell homes faster and recover money tied up in construction, but each sale becomes less profitable.
Lennar’s volume-first strategy can be seen when looking at three factors: the price of each home, the number of homes delivered and the profit margin on each sale. Looking at all three at once, the figures from recent quarters show that the company is keeping its factory running but earning less from each sale.
In the third fiscal quarter of 2026, Lennar’s average selling price was $372,000, below its forecast of $375,000-$380,000. This suggests that prices faced more pressure than management expected. Deliveries, on the other hand, have held up better than orders. In the second quarter, Lennar delivered 20,519 homes and generated 21,749 new orders. The third quarter met its forecasted number, at 20,840 homes delivered, within its 20,500-21,500 range. However, third-quarter orders were 20,879, down from 23,000 a year earlier and below expectations. Deliveries reflect contracts signed earlier, so fewer orders may suggest fewer sales in the future. Management also lowered its full-year delivery forecast to around 80,000-81,000 homes.
Profit margins show the cost of supporting sales. Homebuilding gross margin was 15.8%, up from 15.6% the previous quarter, but remained below the 17.5% recorded in the third quarter of 2025. The 170-basis-point gap reflected lower revenue per square foot and higher land costs, partly offset by construction savings. Although incentives have declined sequentially, they remain elevated and continue to weigh on profitability.
This outlook suggests that the trade-off will continue. For the fourth quarter, management expects 22,000-23,000 deliveries, a gross margin of 15.5%-16% and EPS of approximately $1.30-$1.65, subject to market conditions. Lennar is aiming for more homes at roughly the same profit per home.
Looking at profit margins per home, Lennar is giving up a meaningful amount of money on every sale just keep sales consistency. The benefit side is turnover and capital. Looking at the balance sheet, it ended the second quarter with $1.8bn in cash and total liquidity of $4.9bn, including available borrowing capacity. Homebuilding debt represented 15.8% of its total capital, which suggests financial flexibility. The company also started construction on roughly as many homes as it delivered, around 20,600. Keeping production in line with sales can help prevent inventory from building up, and fewer unsold homes can mean lower holding costs, interest and the risk of later write-downs.
Lennar’s approach to land also helps: as Lennar controls most of its land through options rather than directly owning it, it commits less capital to land that could lose value if prices fall. A volume strategy is easier to sustain when the company is not tied to large land positions. However, weaker demand could make the strategy harder to maintain. Third-quarter new orders fell 9.2% in one year. If orders keep on falling, the company will need higher incentives to hold its delivery pace, which would push margins even lower. As management already cut its delivery outlook, it shows how Lennar has limits on how far it will push volume. Overall, the strategy may work in the short term, but faster sales must generate enough cash benefits to justify lower profits. The key test is whether they can rebuild margins while maintaining deliveries.
D.R. Horton [NYSE: DHI]: Protecting Margins
D.R. Horton [NYSE: DHI] is facing a similar affordability constraint as Lennar, but has taken a different approach, accepting lower sales expectations to protect margins. The company has been the largest U.S. homebuilder by volume since 2002, serving first-time, move-up and other buyers through a national operating platform. It closed 84,202 homes in FY2026, with approximately 43,500 purchased by first-time buyers. That customer mix leaves it exposed to changes in mortgage affordability. Its response is to manage the price, financing package and production pace within each community to stimulate interest in homes.
The distinction from Lennar became clear on D.R. Horton’s July 2026 earnings call. Management said it had chosen to keep additional margin rather than push sell more units, contributing to a reduction in its full-year guidance. Lennar, by comparison, continued to emphasize production and sales volume to drive down construction costs. D.R. Horton’s approach gives local operators more room to accept a slower sales pace when the additional concessions needed to secure a buyer would weaken returns. This allows the company to adjust its sales pace when the additional incentives required to attract buyers would significantly reduce profitability.
Selective incentives still involve a substantial cost. D.R. Horton uses mortgage-rate buydowns to improve affordability, alongside adjustments to selling prices and product offerings. These incentives improve affordability but reduce the profit retained on each sale. D.R. Horton’s June 2026 filing attributed part of its year-on-year gross-margin decline to higher incentives, including mortgage-rate buydowns.
Cost control provides another way to support affordability. In the quarter ended June 30th, 2026, D.R. Horton’s construction costs per square foot, excluding land, fell 5% year on year, while lot costs increased 5%. The largest savings in construction costs came from framing and associated labor. These improvements helped gross margin exceed guidance despite the selling environment. Margins cannot be assessed through incentives alone. Lower construction costs will offset reduced selling price, but higher land costs will suck that margin up prior to hit to earnings.
The fourth-quarter results showed the limits of that protection. In the three months ended September 30th, net orders fell 7% year on year to 18,619 homes, while deliveries declined 2% to 22,915. The cancellation rate increased from 20% to 23%. The faster declining rate of orders compared to deliveries Indicate that the next quarter is starting with weaker demand than the current one. The figures also make it difficult to separate the effects of management’s pricing decisions from the broader slowdown in demand.
Gross margin also captures only part of the cost of accepting lower volume. D.R. Horton’s selling, general and administrative expenses increased from 7.9% of revenue to 8.7% in the September quarter. Protecting the gross profit on an individual home can still coincide with weaker operating profitability when the company sells fewer homes across its platform.
On a balance sheet basis, D.R. Horton Is waiting for. Higher prices for its home’s currently under construction. The company currently has 17,700 unsold homes, including 8,800 that were already completed. Of the completed inventory, 600 homes had been finished for more than six months. A completed property has already absorbed most of its construction cost, but the builder does not recover that cash until the sale closes. Waiting for a better price may help to preserve the marginal profit, while keeping capital committed for a longer time period. The economic benefit depends on whether the additional profit exceeds the carrying costs and the return lost due to delayed reinvestment elsewhere.
D.R. Horton’s therefore attempts to manage the number of units that it puts into the sales pipeline as well as the concessions offered on existing inventory. Its operating strategy links construction starts to local demand and attempts to manage completed inventory. Reducing starts may help to limit future cash commitments, but does not recover the cash already invested in completed homes. In a prolonged slowdown, the production restraint may prevent a larger inventory problem, while existing properties can still require discounts to release cash. The most effective margin discipline is to try and keep as much as possible from being committed to inventory before a buyer is found for the home.
For the homebuilder, selling a home earlier in the process mitigates some of its exposure. During D.R. Horton’s April 2026 earnings call, management explained that homes sold before completion generally achieve somewhat better margins than completed properties. Buyers still have choices over the lot or certain features, while the builder faces less pressure to remove finished inventory from its balance sheet. Securing the buyer earlier can therefore improve both profitability and the timing of cash recovery. This is different from holding completed homes indefinitely in pursuit of a higher price. The intent is to maintain sufficient inventory to meet demand while not allowing completed inventory to dictate pricing for the next sale.
The latest outlook suggests that this balance will remain difficult. D.R. Horton guided to a home-sales gross margin of 18.0% to 18.5% for the first quarter of FY2027, below the 19.5% achieved in the September quarter. Its more selective approach has preserved a margin advantage over Lennar’s recent reported results, but it has not exempted the company from affordability pressure. D.R. Horton’s higher margins therefore need to be considered alongside the amount of capital committed to land and inventory, where the two companies’ operating models differ further.
Land Strategy and Capital Allocation
On paper, both companies are land-light. In practice they are set up very differently, and that difference explains a good part of the margin gap. Lennar has pushed almost all of its land off the balance sheet. At the end of its third quarter it owned just 11,800 homesites while controlling 476,000, roughly six years of supply. D.R. Horton also controls more land than it owns, but it still owned 22% of its roughly 570,000 lots at the end of June. By our estimate, that is around 125,000 lots.
Most of Lennar’s land is held by Millrose Properties [NYSE: MRP], which Lennar spun off in 2025. Millrose buys and develops the land, and Lennar has the option to take down finished homesites when it needs them, paying a monthly fee until it does. In March 2026 Lennar had about $6bn invested at Millrose at a weighted average yield of 8.5%. We estimate that comes to roughly $500m a year in option costs. In the third quarter, 86% of the homes Lennar delivered were built on land-bank land, land costs per homesite were up about 6%, and option fees rose as some contracts ran longer. Stuart Miller put “the entire margin gap” down to land, not labour, materials or overhead. Put simply, Lennar has sold its land bank and now pays to rent it back, and that rent shows up in its gross margin.
D.R. Horton’s version of this is Forestar, a lot developer it majority-owns and consolidates. At the end of June, Forestar owned or controlled 92,000 lots, and 66% of its owned lots were either under contract with D.R. Horton or subject to a right of first offer. D.R. Horton bought $360m of finished lots from it in that quarter alone. Forestar and third-party developers together supplied the lots for 67% of D.R. Horton’s closings in its second quarter. What really separates the two set-ups is who takes the hit if land values drop. If Lennar walks away from a Millrose option, it loses its deposit and Millrose’s shareholders absorb the rest, although so far Millrose reports no option terminations. If Forestar’s land loses value, the loss stays inside D.R. Horton’s own numbers.
None of this makes Lennar’s model capital-free. Its deposits and pre-acquisition costs on real estate added up to $7.3bn at the end of the third quarter, money tied up in land it does not own. And so far the lighter balance sheet has not delivered better returns. Lennar turned its inventory 2.4 times, for a return on inventory of just under 13%, while D.R. Horton’s homebuilding return on inventory was 20.1% in fiscal 2025. Lennar saves capital, but it pays away more in margin, to Millrose and to buyers, than that saving is worth.
Where the lower margin does pay off is in moving finished homes. Lennar ended the quarter with about 3,100 completed unsold homes, or 1.8 per community, down from 3,500 in the second quarter and 5,100 in the first. D.R. Horton had 17,700 unsold homes at the end of September, and, as the previous section noted, 8,800 of them were already built. Measured against a quarter of deliveries, that is about 15% for Lennar (3,100 against 20,840) and about 38% for D.R. Horton (8,800 against 22,915), on our numbers. Lennar’s discounts turn finished homes back into cash faster. D.R. Horton’s patience means more of its capital sits in completed homes while it waits for the right price.
The two also use their cash differently. D.R. Horton put $2.0bn, $2.1bn and $2.1bn into lots, land and development over the first three quarters of fiscal 2026, about $6.2bn in nine months. Even so, it returned $4.1bn to shareholders over the year, more than the $3.5bn it generated from operations. Lennar bought back $993m of stock in the nine months to August and paid $119m in dividends in the third quarter. Most of its land spending goes through Millrose takedowns, and Millrose booked $626m and $567m of net proceeds from Lennar in the first two quarters of 2026. D.R. Horton owns more land and still hands back more cash, which suggests its extra margin is paying for both.
D.R. Horton also has more room on liquidity. It closed fiscal 2026 with $7.2bn available, paid off $600m of senior notes in October 2026 and has no other senior notes coming due in fiscal 2027. Lennar ended its third quarter with $1.2bn of cash and $3.6bn of total liquidity. It had drawn $650m of its $3.1bn revolving facility, had $1.7bn outstanding on its term loan, and its next note matures in June 2027. Homebuilding debt at 16.6% of total capital looks comfortable, but it leaves something out. In a downturn the Millrose option fees work much like lease payments, so if they are treated that way, Lennar carries more leverage than its balance sheet shows.
Conclusion
D.R. Horton appears better positioned to absorb a prolonged slowdown through its higher gross margins and substantial liquidity. Its 19.5% home-sales gross margin in the September quarter provides more room to offer incentives, while its limited near-term debt maturities reduce refinancing pressure. However, the company also retains greater exposure to land ownership and completed inventory, leaving more capital committed if demand remains weak or prices decline further.
Lennar has adopted a different approach, prioritising sales volume and reducing the amount of land held directly on its balance sheet. This has helped limit completed inventory and maintain construction efficiency, but incentives and land-banking costs continue to weigh on margins. Its negative operating cash flow over the first nine months of FY2026 also shows that the model still requires substantial working capital. The benefit of faster sales therefore depends on whether improved inventory turnover can compensate for lower profitability per home.
A recovery in housing demand would benefit both companies, although through different mechanisms. Lennar’s incentive rate of approximately 12%, compared with its historical range of 4% to 6%, leaves room for margin improvement if affordability strengthens. D.R. Horton could benefit from faster sales of completed inventory and lower holding costs while maintaining its higher margins. The comparison ultimately depends on whether the benefits of Lennar’s faster production cycle and lower direct land ownership outweigh the profitability and financial flexibility retained by D.R. Horton. The more relevant measure will be how effectively each company converts its capital committed to land and inventory into cash and returns as housing demand recovers.
References
[1] National Association of Realtors (NAR), “Existing-Home Sales Increased 1.5% in September, According to NAR Report”, 2026. Link
[2] U.S. Census Bureau, “New Residential Sales, September 2026”, 2026. Link
[3] Freddie Mac, “30-Year Fixed Rate Mortgage Average in the United States”, 2026, Federal Reserve Economic Data (FRED). Link
[4] Realtor.com Economic Research, “The Slow Unlock Stalls as Rates Climb”, 2026. Link
[5] Experian, “Average U.S. Mortgage Debt Increases to $264,162 in 2026”, 2026. Link
[6] Redfin / Stacker, “Austin’s 2025 Housing Market Year in Review”, 2025. Link
[7] Lennar Corporation, “Q3 2026 Earnings Call Transcript”, 2026. Link
[8] Lennar Corporation, “Lennar Completes Spin-off of Millrose Properties”, 2025. Link
[9] D.R. Horton, “Fourth Quarter and Fiscal 2025 Earnings”, 2025. Link
[10] D.R. Horton, “Fourth Quarter and Fiscal 2026 Results”, 2026, Form 8-K. Link
[11] Millrose Properties, “First, second, and third Quarter 2026 Financial Results”, 2026. Link


0 Comments