Introduction
Around the same time last year, we published our first article covering the Dutch Pension Reform and its potential implications on markets. The Dutch pension reform appeared to offer a relatively clear opportunity in European rates markets. As pension funds moved away from defined-benefit promises, their need to hedge ultra-long liabilities was expected to decline. Investors therefore anticipated that funds would unwind long-dated receiver swaps, pushing long-end swap rates higher relative to shorter maturities and steepening the EUR swap curve which was the main trade last year’s article correctly identified. This became one of the dominant themes in EUR rates during 2025 as markets prepared for the first major transition wave in early 2026.
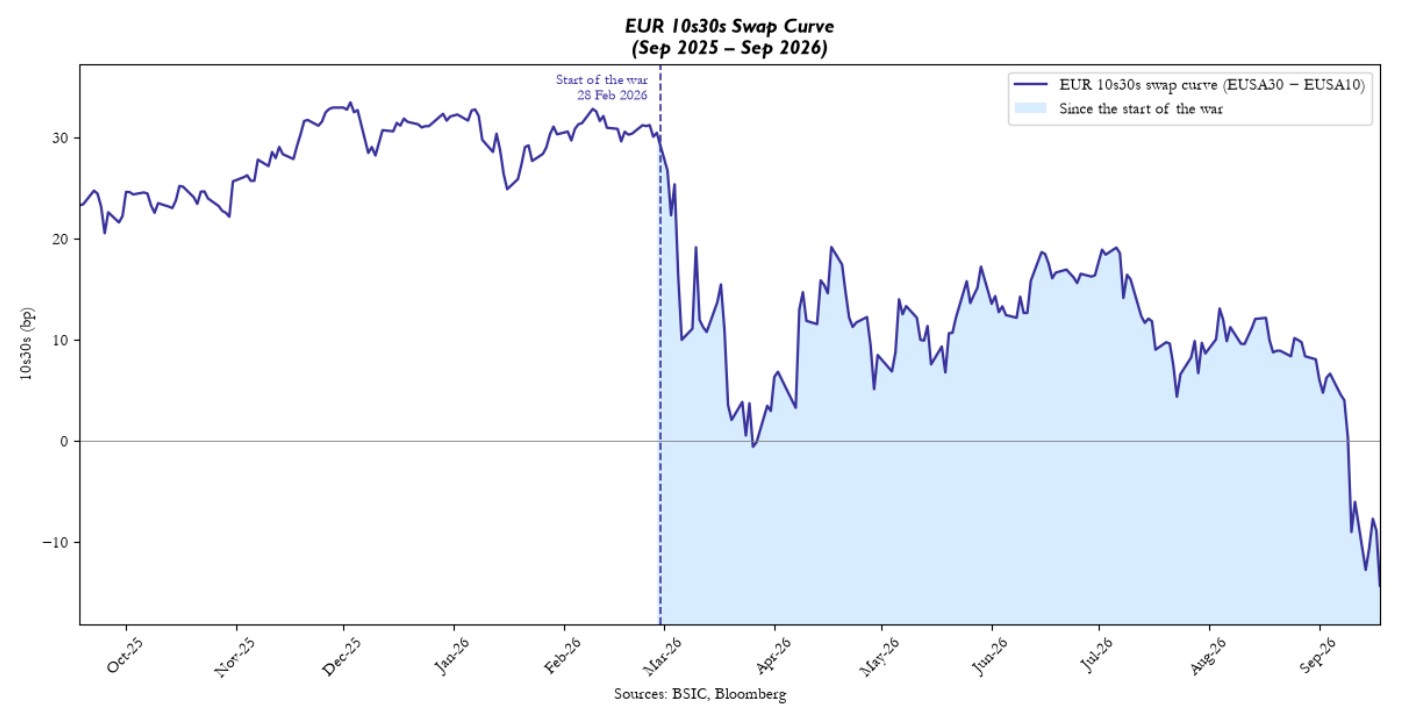
The initial results of the actual transition, however, were less straightforward. Approximately €550bn to €600bn of pension assets entered the new system without causing the abrupt long-end repricing some investors had anticipated. At the same time, the very popular 10s30s EUR swap steepener had become increasingly crowded. When the war involving Iran triggered an energy shock and a repricing of global monetary policy, the curve bear-flattened sharply and fast-money investors were forced out of the trade.
The structural thesis has nevertheless not disappeared. More than €900bn of pension assets are expected to transition in 2027, including approximately €530bn managed by ABP. This article recaps briefly how the reform affects pension liabilities and annual income, comments on what happened in early 2026 and what we can expect in 2027 and proposes a trade that we believe is the best expression to capture the market impact of next year’s transition.
A Quick Recap
The Dutch pension reform changes the basis on which funds manage investment and interest-rate risk. Under the old defined-benefit framework, funds managed assets against accrued pension entitlements, broadly determined by salary and years of service. These entitlements were conditional: weak funding could restrict indexation or ultimately require benefit reductions. Nevertheless, they created a long-dated liability whose present value increased when discount rates fell.
Funds therefore held long-dated bonds and received fixed rates through interest-rate swaps. Both positions generally gain value when rates fall, helping offset the increase in liabilities and protect the funding ratio which is the ratio of assets to liabilities. Because pension payments extend decades into the future, this generated substantial demand for ultra-long duration.
A funding ratio of 129%, for example, means that the fund holds €129 of assets for every €100 of calculated liabilities. When rates fall and the present value of liabilities rises, the funding ratio deteriorates unless the value of the fund’s assets and interest-rate hedges increases by a similar amount.
Because pension payments extend several decades into the future, liabilities generally have a longer interest-rate duration than the fund’s physical asset portfolio. An unhedged fund will therefore normally benefit from rising rates, which reduce the present value of its liabilities, and suffer when rates fall.
Pension funds traditionally reduced this mismatch by holding long-dated bonds and receiving fixed rates through interest-rate swaps. In a receiver swap, a fund receives a predetermined fixed rate and pays a floating rate. If market rates subsequently fall, receiving the previously agreed fixed rate becomes more valuable. The gain on the swap can therefore offset part of the increase in the value of the fund’s liabilities.
Under the new contribution-based framework, the starting point is instead the pension capital allocated to each participant. This capital is built through contributions and investment returns. The annual pension income it can ultimately support depends on the accumulated capital, future investment performance, interest rates and longevity. Important forms of collective risk sharing remain, meaning the Dutch framework should not be interpreted as a purely individual investment account.
Once a pension fund has entered the new system, its position can no longer be represented by one aggregate funding ratio. However, the funding ratio remains important before and at the transition because it determines how much capital can be distributed among participants. A stronger funding position can lead to larger individual pension pots and, consequently, greater nominal hedging demand after conversion.
How the Reform Affects the Swap Curve
The new system allows pension funds to differentiate investment and hedging strategies more closely by age. Younger participants have longer investment horizons and can generally hold more equities and less interest-rate protection. Older participants have less capacity to absorb market losses and therefore retain greater exposure to fixed income and interest-rate hedges.
For the swap curve, the central mechanism is a redistribution of hedging demand. Younger participants account for much of the longest-dated exposure under the old framework. Reducing their protection should lower demand for receivers beyond 25-30 years. Meanwhile, high hedge ratios for older participants can sustain or increase receiving around 10-20 years.
Closing a long-dated receiver swap removes downward pressure on the long-end swap rate and can require an offsetting payer transaction. Adding shorter receivers puts downward pressure on intermediate rates. Together, these flows support a wider spread between the 30Y and 10Y swap rates which is also the main reason for why a 10s30s EUR swap steepener was a very popular trade last year. A 10s30s steepener expresses this through receiving fixed at 10 years and paying fixed at 30 years.
The First Transition: Notional Flows vs. DV01
The first major test came on 1 January 2026, when 24 funds, including PFZW and PMT, entered the new system. By 30 June, 34 funds had converted, representing €589bn of the Dutch pension sector’s approximately €1.72tn of assets.
The important distinction is between the location of duration and its aggregate amount. Pension funds could increase total receiver DV01 while moving enough exposure from ultra-long to intermediate maturities to steepen the curve. A steepener therefore does not require indiscriminate fixed-income selling.
The first wave showed why transition size alone is an unreliable guide to market impact. Twenty-four funds entered the new system on 1 January 2026. By end-June, 34 had converted, representing €589bn of the sector’s approximately €1.72tn of assets.
Part of the repricing occurred beforehand. ING estimates that pension reform contributed approximately 10–20bp of additional EUR 10s30s swap curve steepening during H2 2025, after accounting for EUR 5s10s and US 10s30s movements. This also becomes clear when looking at the spread as it rose from 22.3bp on 30 September to 32.1bp at year-end, although that observed change cannot itself be attributed entirely to pension reform. At that time, the expected reduction in ultra-long pension hedging became one of the most popular themes in EUR rates.
Actual portfolio adjustments proved more manageable than the anticipated wave of selling. DNB reported just over €10bn of long-dated swap sales by transitioned funds, alongside substantial purchases of shorter-dated swaps. Some funds adjusted before January while others spread their transactions over subsequent months. Funds have up to twelve months after conversion to adjust their investment policy.
These are notional amounts, however, rather than a measurement of the duration released into the market. DV01 measures the change in value associated with a one-basis-point rate move. Converting swap notional into DV01 requires information about maturities, cash flows and the relevant curves and broad maturity buckets alone are insufficient. The available figures therefore support a rotation away from ultra-long exposure, but do not establish a precise realised net DV01 unwind.
ING’s January analysis provides a useful modelled comparison. For the funds transitioning in 2026, its simplified two-cohort model estimated €110m/bp of paying at a 25-year duration and €132m/bp of receiving at a 15-year duration, leaving €22m/bp of net receiving. These were estimates under restrictive assumptions, not measured executions. Nevertheless, they illustrate why long-end paying can coexist with an overall increase in hedging.
Why the Flows were Smaller than Expected
Several factors reduced the initial unwind or its immediate market footprint. First, PFZW’s published post-transition hedge ratios exceeded market expectations, implying that fewer existing receivers needed to be closed. Some funds chose hedge ratios of approximately 20-25% even for younger participants, while older cohorts retained much higher levels of interest-rate protection.
Second, stronger funding positions increased the capital available for allocation to participants. Applying new hedge ratios to larger pension pots can offset part of the reduction caused by shorter hedge durations. A forecast based on weaker funding or lower post-transition protection can therefore materially overstate the expected unwind. DNB reported that the average funding ratio of funds remaining under the old FTK framework rose to 131.4% in the second quarter of 2026. Their policy funding ratio, which is calculated as a twelve-month average, increased to 127.7%. The first-quarter decline following the Middle East shock was subsequently reversed, partly because equity markets recovered. This also demonstrates that funding ratios are not determined by interest rates alone. Higher discount rates can reduce the present value of liabilities, but falling equity prices reduce the value of assets. For funds with high interest-rate hedge ratios, equity movements can therefore have a greater effect on the funding ratio than changes in the yield curve.
Third, execution varied considerably. PMT planned to rebalance over six months, while some other funds completed adjustments rapidly. Generally, funds were not required to complete all their portfolio adjustments on the formal transition date. They were allowed to rebalance their asset allocation and hedges over the following year. ING also reported that funds requiring additional hedges could take over positions bilaterally from those reducing them. Such transfers reduced the imbalance reaching the wider market.
Finally, funds awaiting conversion continued to provide receiving demand. Rabobank describes how these funds maintained elevated hedge ratios to protect their transition funding positions, sometimes increasing protection as rates rose and extending hedging to their funding buffers. Consequently, the sector contained both funds reducing ultra-long exposure and funds still seeking to preserve their pre-transition balance sheets.
The Iran Shock and the Global Rates Repricing
The final blow to the steepener came in March, when the escalation of the conflict involving Iran disrupted energy markets. Higher oil and gas prices created upside risks to inflation and downside risks to European growth. The shock was initially unrelated to Dutch pension funds, but it changed the macroeconomic environment in which the transition was taking place.
The ECB subsequently raised its deposit rate to 2.25% in June and 2.50% in September. By 18 September, 10s30s stood at -14.3bp. The curve’s inversion illustrates that a structural reduction in ultra-long receiving can coexist with substantial flattening when the macroeconomic environment moves against the trade.
The macroeconomic shock also affected pension funds themselves. For an underhedged fund, rising rates generally reduce the present value of liabilities by more than the value of its rate-sensitive assets, improving the funding ratio. A highly hedged fund receives less of this benefit because its bonds and receiver swaps lose value alongside its liabilities. At the same time, equity losses can offset any improvement arising from higher discount rates.
The Iran shock consequently affected the trade through three channels: it changed the shape of the euro curve, triggered the unwinding of speculative steepeners and altered the funding positions of pension funds preparing to transition.
2027: An Even Bigger Round of Dutch Pension Transitions
More than €900bn of pension assets are expected to transition in 2027, compared with approximately €600bn during the first major wave. ABP alone accounts for roughly €530bn, making its hedge ratios and execution schedule particularly important for the long end. At the end of 2025, Dutch funds still held approximately €88bn of swaps with maturities beyond 25 years, representing around one-quarter of their total swap positions.
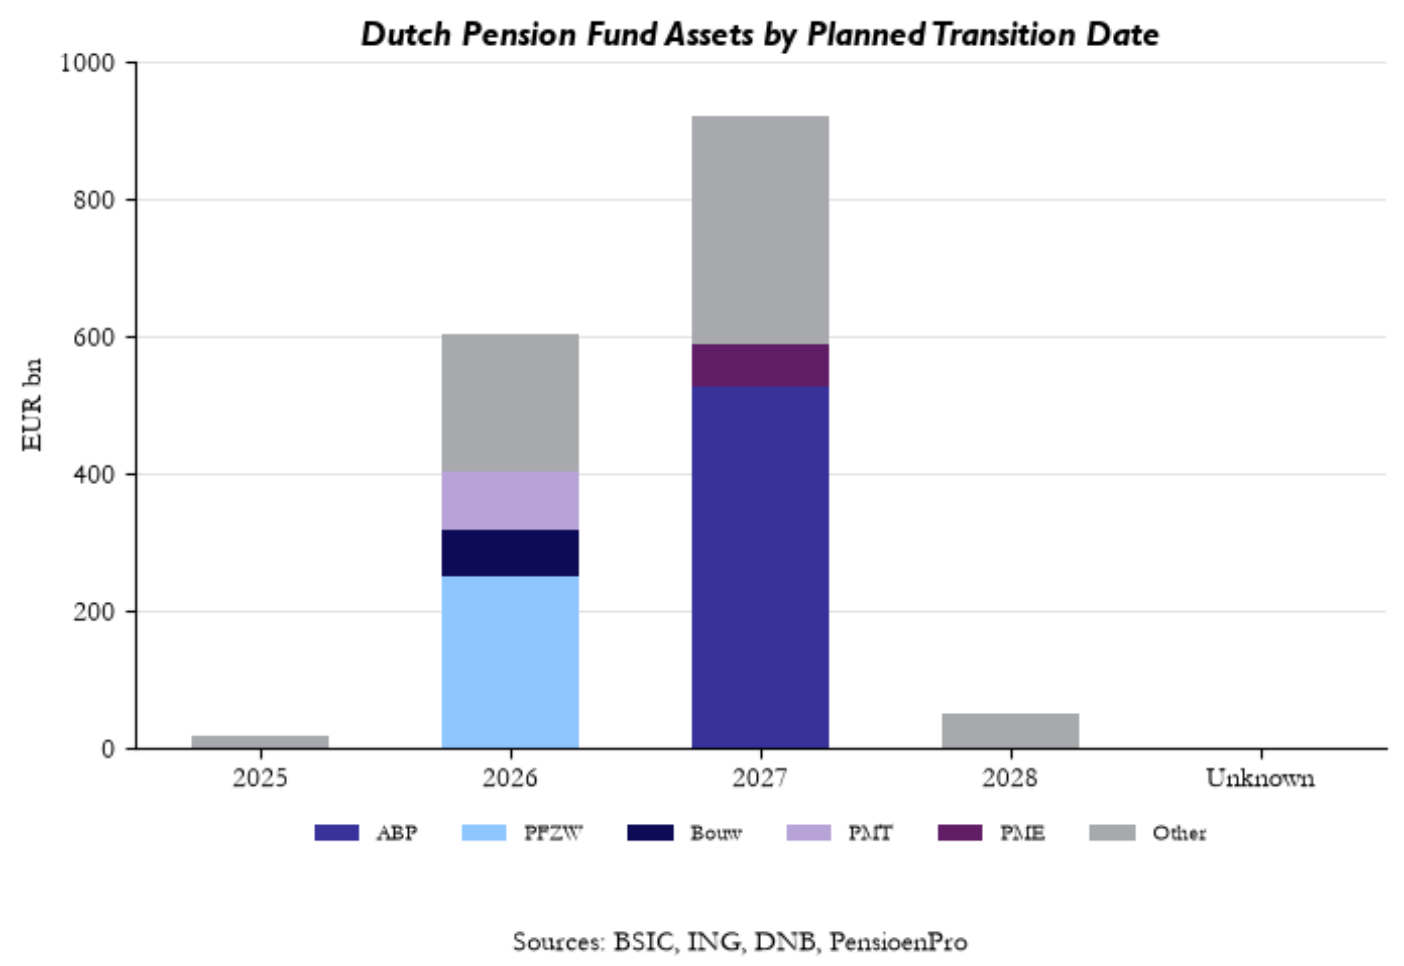
The larger asset volume does not guarantee a proportionally larger curve move. If ABP adopts relatively high hedge ratios similar to those published by PFZW, less long-dated receiver DV01 will need to be removed. Funds may also spread their transactions across several months or reposition before their formal transition dates.
Operational capacity represents another source of uncertainty. More than 50 funds are expected to transition in 2027, compared with 24 at the beginning of 2026, and many rely on the same administrators and service providers. Delays could move expected flows into 2028, while early implementation could cause the market effect to occur during the final months of 2026. However, this also means that there is less scope to transfer long-dated swaps to other Dutch pension funds as more of the sector converts. The first transition’s offsetting demand may therefore be less available, and we could thus potentially see a larger impact of the flows.
The wider fixed-income environment may nevertheless strengthen the structural case for higher long-term rates. Dutch pension funds have historically provided deep and relatively stable demand for long-duration assets.
Given last year’s difficulties of estimating flows and information on hedges and execution ahead of conversion, we do not think that the picture is as clear as it seemed to be last year. The important role of Dutch pension funds in European rates markets, however, still makes this one of the most relevant themes for Europe to follow aside from the geopolitical tensions that are currently driving markets. Therefore, we still believe it is important to think about the potential implications of next year’s transition and especially the positioning for the rest of 2026 as it is extremely hard to forecast how the transition will take place when it actually starts in early 2027.
The Trade Idea for Part II of the Pension Reform & its Catalysts
As already discussed, the most popular way to express the Dutch pension transition, and the unwind of long-dated receiver swaps it is expected to trigger, is a 10s30s EUR swap steepener (vs 6M Euribor). However, this trade is highly sensitive to a renewed escalation in the Middle East, or simply to energy flows through the Strait of Hormuz remaining disrupted for longer. Either would likely push the ECB’s policy path further in a hawkish direction. It would also strengthen a higher-for-longer narrative, as second-round effects from the energy shock, which have so far been limited, become more likely. Because the front end reprices faster than the long end in such a scenario, this is a direct headwind for the steepener.
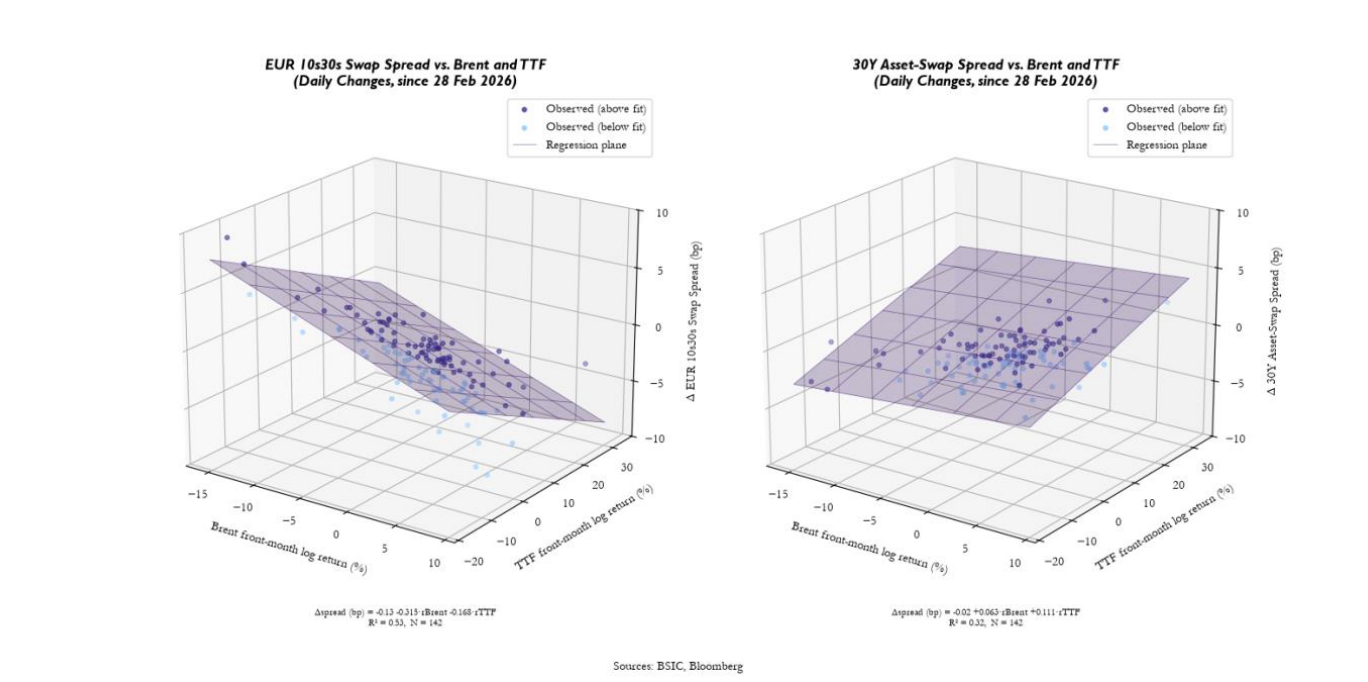
Our simple regression analysis supports this. We regressed daily changes in the 10s30s curve and in the 30Y Buxl ASW on daily log returns of front-month Brent and TTF futures since the start of the war on 28 February (N = 142, Newey-West standard errors). Rising energy prices have consistently flattened 10s30s as a 10% rise in Brent is associated with around 3bp of flattening (t = -5.7) and a 10% rise in TTF with around 2bp (t = -3.0), with energy explaining more than half of the daily variation (R² = 0.53). This is consistent with the front end repricing faster than the long end. The 30Y ASW is less exposed. Its sensitivity to oil is small and only marginally significant (+0.6bp per 10%, t = 2.0), roughly a fifth of the curve’s. While it widens when gas rallies (+1.1bp per 10%, t = 3.6), that sensitivity is about a third smaller than the curve’s, and energy explains considerably less of its moves (R² = 0.32). The results are robust to using non-overlapping 5-day changes, which give the same signs and similar magnitudes.
The steepener is arguably still the cleanest expression of the theme. Under the new pension contracts, interest-rate hedging is set per age cohort: high for retirees, low for younger members. These cohort hedges are aggregated into a fund-level hedge ratio, and the hedge now targets the fund’s assets rather than a liability stream stretching out beyond 50Y. The result is less need for 30Y+ receivers and more concentrated receiving demand inside 20-25Y.
The January 2026 wave showed exactly this pattern. Between October 2025 and March 2026, funds transitioning on 1 January net-received almost €34bn of sub-25Y swaps while paying over €12bn beyond 25Y according to DNB and AFM data. With around €900bn of assets moving on 1 January 2027, more than half of it ABP, the same pattern should recur on a larger scale. Nonetheless, the steepener’s sensitivity to energy prices leaves it heavily exposed to further front-end repricing if the war in Iran drags on.
We therefore prefer a long 30Y Bund asset swap: long the DBR 2.9% 56, paying fixed vs 6M Euribor. We quote the spread as bond yield minus swap rate, so the position benefits when the spread tightens. We believe there are four main arguments that support it.
First, funds unwinding long-dated receivers primarily affects swaps rather than bonds, cheapening 30Y swaps relative to Bunds. Most funds credit members’ returns against a 6M-Euribor-based benchmark, which gives them a strong incentive to keep hedging in swaps rather than bonds to avoid mismatch.
Second, it should be less exposed to the energy scenario that hurts the steepener, as our regression shows. From our regression we can also infer that higher and steeper expected policy paths which are mainly driven by energy prices in the current regime, correlate with richer Bunds versus swaps, as payer hedging ahead of rate hikes lifts swap rates.
Third, it offers positive running carry. The 30Y Bund yields roughly 43bp over 6M Euribor swaps, and 6M Euribor fixes well above Bund repo. As of September 20th, the three-month carry and rolldown of the trade is 1.6bp assuming an annualised repo rate of 2.513%.
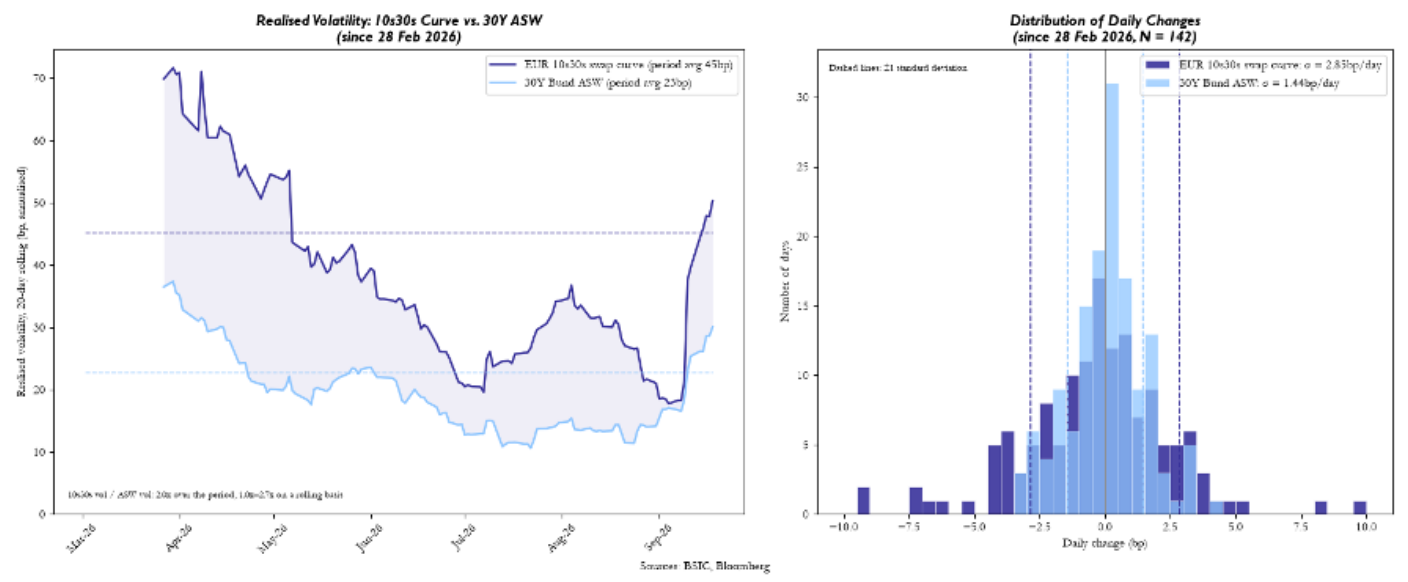
Fourth, it is a less volatile position than the curve trade. The 30Y Buxl ASW spread has a realised annualised volatility of 22.8bp vs 45.2bp for 10s30s since the start of the war in the Middle East.
We want to be clear that this is a flow-driven rather than a purely macro-driven trade. Our trade is therefore still a bet that the positioning for Dutch paying flows and not an expression targeting a fundamental bullish repricing of long-end bund yields although we believe that they are well supported at the moment.
A Tailwind from European Insurers?
Even though it is not the main topic of this article, the Solvency II review, which applies from 30 January 2027, could be another factor providing some support for the Buxl leg of our trade. For us, the relevant change is not the capital relief. It is how EIOPA extrapolates the risk-free curve that insurers use to discount their liabilities.
Under the current approach, the curve follows market swap rates to 20Y and is then pulled quickly towards the ultimate forward rate (UFR). Liability values therefore barely respond to where 25-50Y rates trade, and insurers have had little reason to hedge beyond 20Y. The new method keeps 20Y as the first smoothing point for EUR, with scope to move further out if long-end market depth increases. But it gives market forwards beyond 20Y much more weight and slows the convergence to the UFR considerably. Insurers’ long-dated liabilities therefore acquire genuine rate sensitivity in the 20–50Y sector, and with it a new incentive to add duration there.
That duration can come through receivers or bonds, and we expect bonds to be favoured in the current regime. 30Y Bunds still offer a meaningful yield pick-up over 6M Euribor swaps, and EU sovereigns carry no spread or concentration charge under the standard formula. This is where Solvency II meets the Dutch transition. Dutch funds are unwinding long-dated receivers, a flow that mainly hits swaps, while insurers’ new demand is more likely to show up in bonds. Both of these factors support richer bonds versus swaps at the long end, all else equal. The new extrapolation is phased in over five years to 2032, so this is a gradual bid rather than a January event.
The recalibrated volatility adjustment is another factor that could potentially support bunds, as German insurers currently allocate one of the smallest shares of their portfolio to domestic bonds compared to other eurozone insurers. Insurers remain exposed to sovereign spread moves from an asset-liability perspective. The new volatility adjustment has a higher baseline and responds continuously to spread moves rather than switching on at a trigger level. This should make insurers more comfortable holding domestic sovereigns and less likely to sell them in a spread sell-off. That supports more of a home bias for eurozone insurers, while it is a bit questionable whether we will see large selloffs in domestic spreads in the eurozone, given the fact that the potential for a large sell-off is definitely higher for countries such as France or Italy in our view.
Key Risks of the Trade
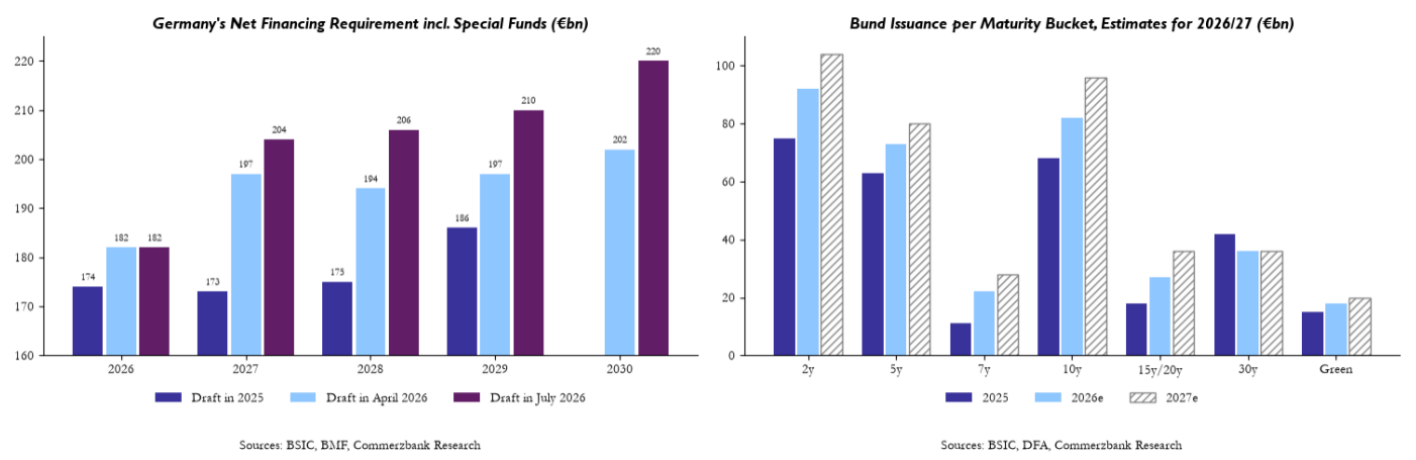
One risk for Bunds is Germany’s steadily rising deficit. The draft budget published in July projects a €204bn net financing requirement for 2027, about €48bn more over four years than previously planned. Commerzbank expect record gross Bund issuance of around €400bn next year. Yet swap spreads barely reacted to the revised plans. We don’t believe that markets are completely insensitive to new supply headlines, but it indicates that a lot of the increased issuance is already priced in offering better support across the Bund curve.
Rising deficits and supply generally cheapen Bunds versus swaps, but the tenor split matters. Sell-side research expects 30Y issuance to stay broadly unchanged at around €36bn in 2027. Most of the increase should come in the 2Y, 10Y and 15/20Y buckets, as the DFA leans into strong demand for 15-20Y paper. This should support the 30Y ASW relative to other points on the curve. Total duration supply still rises nonetheless. On the current supply picture, we believe that the main risk is already behind us as the German DFA syndicated €4bn of the current on-the-run 30Y benchmark on August 18th.
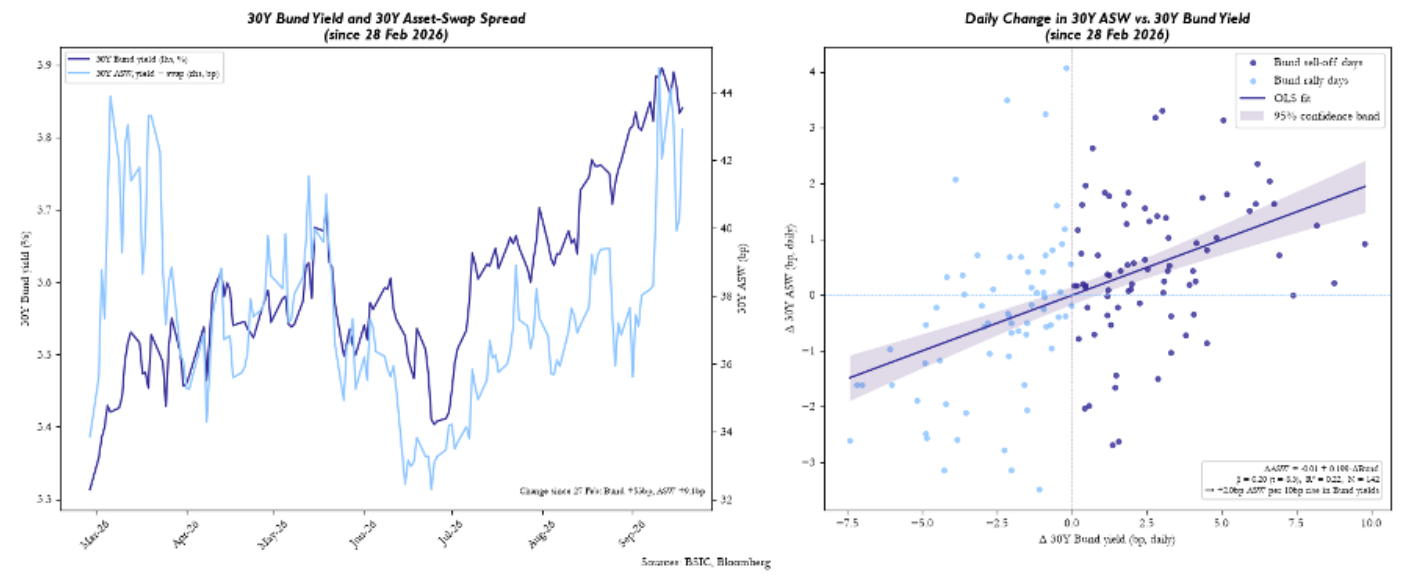
Another key risk to the trade is a renewed global sell-off at the long end. Over the past months, ultra-long yields have risen across developed markets. This was driven by the energy-related inflation shock and higher policy rates, but also by growing investor concern about fiscal deficits and debt-to-GDP ratios. As an asset swap is duration-hedged, what matters is not the level of yields but how the ASW behaves in a sell-off. Since the start of the war, the 30Y ASW has cheapened by around 2bp for every 10bp rise in 30Y Bund yields (daily changes, β = 0.20, t = 8.3); over the period, Bund yields rose 53bp while the ASW widened by 9bp. Notably, the ASW shows no sensitivity to moves in the 30Y swap rate itself (β = 0.02, t = 0.4). The trade is therefore not exposed to higher rates as such, but to sell-offs led by government bonds, where Bunds underperform swaps.
Furthermore, spillovers from US Treasuries. Long-end yields across major markets move closely together, so higher US term premia therefore push up European yields as investors reprice euro-area duration against the alternatives. To the extent such spillovers hit swaps and bonds equally, the ASW is protected. The risk is a sell-off concentrated in government bonds.
Additionally, around €60bn of Bunds mature in the ECB’s portfolio in 2027, lifting ECB-adjusted net supply to a record of around €252bn. Conversely, according to Bloomberg, the ECB could reach its desired level of reserves as early as Q4. That would bring the end of balance-sheet run-off closer and remove a source of supply, an upside scenario for the trade.
Lastly, the shape of Dutch flows after January. Under lifecycle hedging, funds rebalance monthly, adding hedges when rates rise and trimming them when rates fall. If the swap unwind turns out smaller or more gradual than expected, the flow support behind the trade would fade, so the position may require patience in the months up to the transition.
Entry-Level, Horizon, Sizing, Target & Stop-Loss
The 30Y Bund ASW (DBR 2.9% 2056, quoted as bond yield minus 6M Euribor swap) currently trades at around 43bp. That is close to its widest level of the past year (44.7bp on 10 September) and almost 10bp wider than before the war (34bp). We would enter around next Wednesday’s €1bn reopening of the bond. Ultra-long Bunds often cheapen into auctions to make room for the new supply and recover afterwards. Entering on the auction day is therefore a good opportunity.
The January 2026 wave showed that the transition date itself is not the trade. Funds had largely pre-positioned and netted their flows, so the expected long-end paying around 1 January had little visible impact. The market did, however, trade the run-up. The 30Y ASW tightened from around 38bp at the end of September to a low of 22bp on 29 December 2025, then retraced almost 9bp in the first two weeks of January.
We therefore want to own the positioning ahead of the transition, not the transition itself. We plan to hold the trade into December and close it before year-end, a horizon of roughly three months. Exiting early also protects us from two supply events, as the DFA’s 2027 issuance calendar is released in December, and the new-year syndications, which could include a new 30Y benchmark.
A precise target is difficult to pin down. Last year’s low of 22bp can serve as an orientation target if positioning builds as it did in Q4 2025. This year’s positioning should become clearer over the coming months giving us more clarity about where the spread can actually go.
We would place the stop at 53bp. That is about one three-month standard deviation above entry (around 10bp, based on a daily σ of 1.3bp over six months) and roughly 8bp beyond the widest level of the past year. We see it as the level at which the thesis is invalidated. Even though it seems quite tight by statistical standards, getting there would likely take either another sell-off led by government bonds or a German-specific supply shock. At that point, positioning for the Dutch transition would clearly not be supporting the spread enough to compensate for other factors.
Conclusion
The first major transition did not invalidate the Dutch pension thesis. Instead, it demonstrated that the original interpretation had been too simple. Pension funds reduced receiver positions at the ultra-long end but simultaneously increased receiving at shorter maturities. Higher funding ratios, larger pension-capital allocations and higher-than-expected age-specific hedge ratios further reduced the amount of duration removed from the market.
The March shakeout demonstrated a separate problem: a structurally plausible trade can still suffer large losses when it becomes crowded and encounters an independent macroeconomic shock. The Iran-driven energy shock, subsequent ECB hikes and the latest Fed increase shifted the market’s focus from pension flows towards inflation and monetary policy. The resulting bear-flattening was then amplified by investors closing steepener positions.
The 2027 wave is larger, but its impact will depend more on ABP’s hedge ratios and execution strategy than on the headline amount of assets. While we still believe that this could be a major catalyst for future resteepening of the EUR swap curve, in the current regime, we are not confident anymore whether this remains the best expression going into the new transition cycle and instead believe that an asset swap is a cleaner, less volatile and better supported trade this time around. The structural pressure on ultra-long demand remains, but the experience of 2026 shows that being right about the theoretical impact is not sufficient as positioning, timing and execution will determine what impact future Dutch pension fund flows will have on European rates markets.
References
[1] DNB, Pension transition and pension fund funding ratios – 2026Q2, https://www.dnb.nl/en/general-news/news-2026/pension-transition-and-pension-fund-funding-ratios-2026q2/
[2] ABN AMRO, Pension transition proves less disruptive than feared, June 2026
[3] ING, The guessing game behind Dutch pension flows, January 2026 https://think.ing.com/articles/the-guessing-game-behind-dutch-pension-flows/
[4] ING, A bigger round of Dutch pension transitions puts curve steepening back in play, June 2026 https://think.ing.com/articles/a-bigger-round-dutch-pension-transitions-puts-curve-steepening-back-in-play
[5] Global Finance, Europe’s Long-Bond Market Faces €1.6T Dutch Pension Shock, September 2026 https://gfmag.com/economics-policy-regulation/europe-long-bond-market-faces-dutch-pension-shock/
[6] ECB, Monetary policy statement, March 2026 https://www.ecb.europa.eu/press/press_conference/monetary-policy-statement/shared/pdf/ecb.ds260319~30247d385d.en.pdf
[7] ECB, Monetary policy decisions, June 2026 https://www.ecb.europa.eu/press/pr/date/2026/html/ecb.mp260611~4d41bd5e83.en.html
[8] ECB, Monetary policy decisions, September 2026 https://www.ecb.europa.eu/press/pr/date/2026/html/ecb.mp260910~314e508016.en.html
[9] Global Finance, OECD: A world awash in debt, April 2025 https://gfmag.com/economics-policy-regulation/oecd-a-world-awash-in-debt/
[10] Commerzbank: Bund Supply 2027: Prepare for more!, July 2026
[11] Commerzbank: Swap Spreads – What is fair?, September 2026
[12] Rakobank: The death of dynamic hedging?, September 2026



0 Comments