Introduction on recent market developments
After a subdued performance of equities in 2022 (-18.01% dividends adjusted), January has seen a significant turning point for US equities, given the recent strong rally. This article will briefly summarize what happened in markets this last month, outlining the causes of the US equity rally and analyzing the recent shift in monetary policy expectations. We will look if this outperformance compared to other asset classes was justified from a fundamental perspective. Furthermore, because of the bifurcation of data, we will discover what equity valuations, earnings, and the equity risk premium tell investors about the current macroeconomic environment. We will end this article with a trade idea based on our findings.
After a very strong start to the year for financial markets, February saw that go reverse, with losses across equities, credit, sovereign bonds, and commodities. That came amidst growing concern about the persistence of inflation, which led investors to ramp up their expectations for central bank rate hikes. This marked a recovery for the US Dollar. The YTD performance of financial assets is still generally positive, with most of those we track still higher over 2023 so far.
January’s solid equity performance was due to many factors, which included: falling inflation expectations, lower energy prices, China reopening, short covering, CTA’s buying, falling rates volatility, increase in global liquidity, and retail inflows. For an in-depth analysis of China’s reopening, please look here. It is estimated that in December CTAs bought a total of $175bn in global equities and are currently net long $78bn. This net buying was one of the largest on the time series available. Bond volatility also gives individuals a clear picture of market expectations; implied volatility one year ahead for five year rates has been crushed, suggesting a decrease in macroeconomic uncertainty. 1 year inflation swaps also dropped substantially, with CPI forecasts seen at 2.5% by late summer, telling investors that inflation will rapidly fall.
Having just experienced a strong rally in January, the initial market mood was positive as February began. However, that all changed on the third day of the month when the US jobs report for January was released. It showed that nonfarm payrolls had risen by +517k in January, marking the most substantial job growth in six months. This and the unemployment rate falling to a 53-year low of 3.4% marked a turning point for markets. This data raised fear among investors that inflation would remain more sticky than anticipated. Upward revisions followed this news on employment in inflation data from late-2022. These showed that CPI had fallen less rapidly than thought over Q4, with the 3-month annualized rate of core CPI in December being revised from 3.14% to 4.25%. Then we had the January CPI data, where headline and core CPI remained robust, as did the PCE measure targeted by the Fed. By the end of the month, this meant that expectations of the Fed’s terminal rate had risen from 4.92% to 5.42%.
Investors’ expectations of inflation also saw a sharp move higher, with the 2yr breakeven up from 2.33% to 3.18% over the month. The result of all this was a dramatic slide in global bonds. US Treasuries (-2.4%) suffered their worst monthly performance since September, and Bloomberg’s Global Aggregate Bond Index (-3.3%) saw its worst February performance since its inception in 1990. Equities also struggled, with the S&P 500 peaking for the month on the day before the jobs report came out, before closing -2.4% lower. However, one of the few assets that benefited from this shift in Fed pricing was the US Dollar, with the dollar index (+2.7%) ending a run of 4 consecutive monthly declines. Furthermore, the US M2 money supply fell 1.7% Y/Y in January, the most significant decline on record and the first time it has contracted in two consecutive months. However, the money supply is still 39% higher than before COVID, suggesting that the FED still has more work to do.
Here below is a graph that shows how the market has repriced the Fed Funds Rate following the February Employment Report:

Source: Bocconi Student Investments Club
Many of the tailwinds that caused the equity US rally are now becoming headwinds for the market. CTAs positioning in the S&P 500 fell from the 97th percentile ending the week of Feb 17th to the 74th percentile as of now, and since both short-term and long-term momentum is in negative territory, it could mean that CTAs offload a total of $45 billion in S&P. The more significant source of supply in the near term will come from CTAs based on a Goldman Sachs model.

Source: Goldman Sachs
Current market anomalies
The most asked question in markets is how close the Fed is to the peak. One significant milestone has been reached, with the fed funds rate now above the PCE measure of annualized inflation, meaning we now have positive real rates again. Some inconsistencies that that market has recently faced include credit spreads and hard vs. soft data. The yield curve inversion has been a robust indicator for indicating past recessions. The market is anticipating a recession, with the three-month Treasury bonds yielding more than a 10-year bond. However, credit spreads are also a pretty accurate recession indicator, but they are currently predicting nothing. Corporate credit is considered riskier in a risk-off environment because they have credit risk. Hence they pay a higher yield to attract investors. For the credit market to price a recession, the investment grade credit spreads should get closer to 200 bps. Now, they are only at 130 bps. For high-yield spreads, you’d expect 650-800 bps. Currently, they are 418 bps. The head of fixed-income strategy for Bank of America attributes this to the continuing strength of the labor market and the very low initial unemployment rate.
Another big inconsistency the market faces is the divergence between “hard” and “soft” data. Soft data comes from surveys about feelings or perceptions. Hard data is the actual objective data recorded. Survey data fills the gap that historical data cannot provide at a particular time. The “future” is not historical yet, which is why there is so much interest in confidence surveys and assessments of current conditions. Currently, hard data is looking much better compared to surveys, here inserted below is a Goldman Sachs chart that compares surprises in its current activity indicators based on hard and soft data:

Source: Goldman Sachs, Bloomberg
To further analyze this divergence, one must separate ISM surveys of business into “objective” and “subjective” groups. The former includes questions about the future and macroeconomic outlook, while the objective section is about whether new orders are rising or falling, for example. These negative sentiment effects appear to be weighing on business surveys. The weakness in the surveys is much more pronounced across subjective components like “general business conditions” than for objective and quantifiable fundamentals like production, shipments, and employment. Statistically, these subjective measures are not additive to the nowcasting signal from the objective measures—which are not nearly as weak. The graph below shows the biggest divergence since the financial crisis showing how pessimism dominates these surveys.
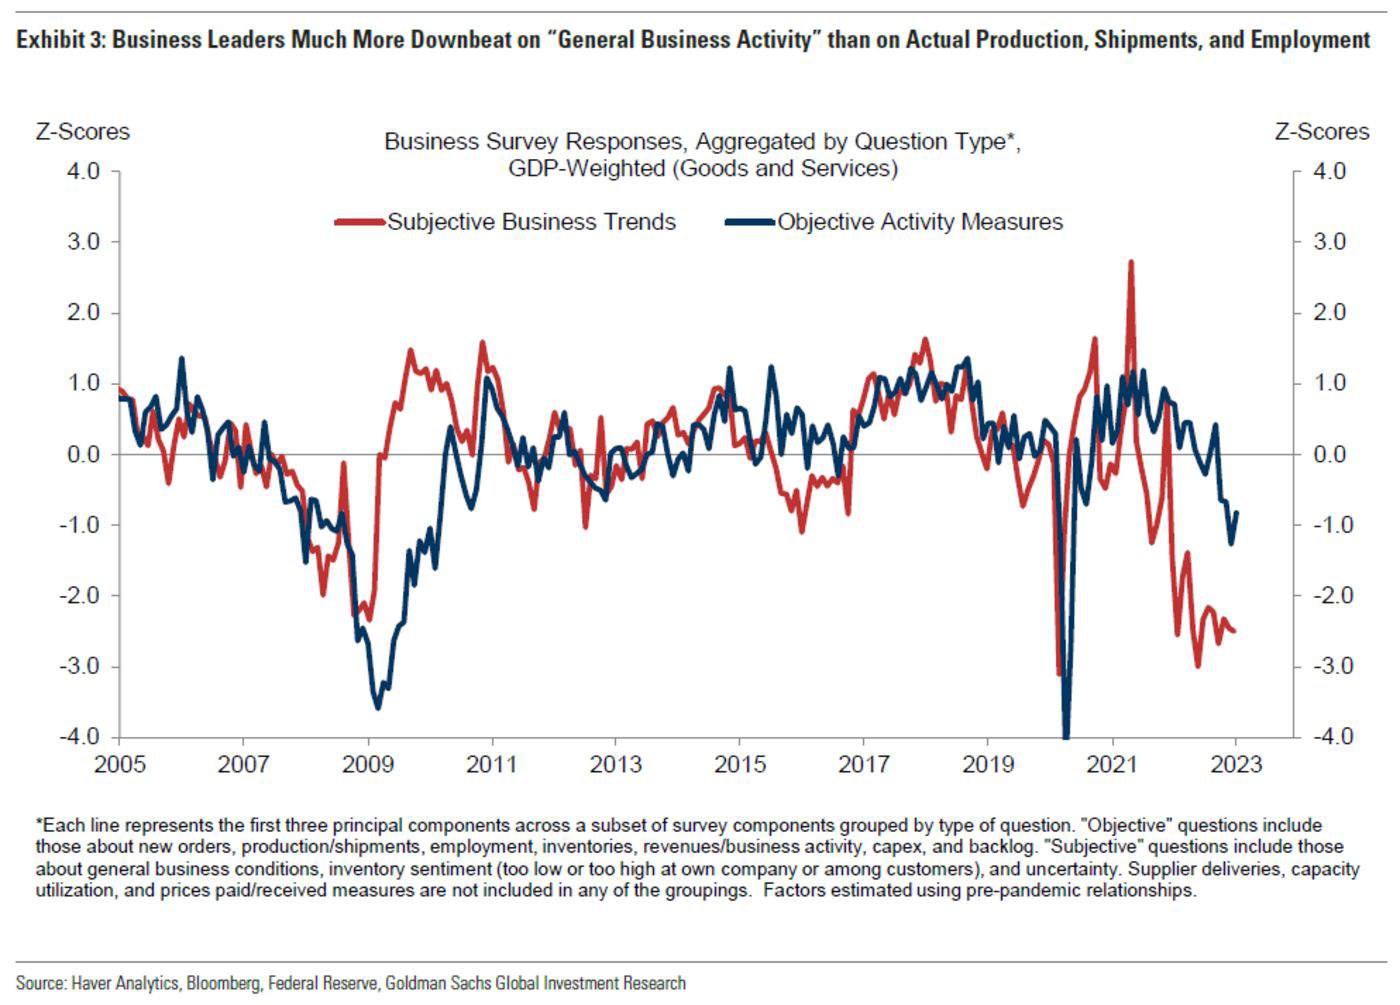
Source: Goldman Sachs, Bloomberg
Current earning season results
According to Factset, the blended earnings growth for the quarter as of last Friday was -4.8% for Q4 2022. 68% of the companies reported actual EPS above estimates. This is well below the 5-year average of 77% and the 10-year average of 73%. Companies reported earnings that were 1.2% above estimates, significantly lower than the 5-year average of 8.6% and the 10-year average of 6.4%. More interestingly, during the two days before and after the earnings release, companies that reported positive surprises experienced a price increase of +1.1%, above the 5-year average price increase of 0.9%. On the other hand, companies that reported negative surprises experienced a price decrease of -0.6%, less than the 5-year average price decrease of -2.2%. The market rewarded positive earnings surprises more than average and punished negative earnings surprises less than average. As noted by equity strategist Mike Wilson, this might continue last year’s pattern to discount upcoming results during the last month of the quarter and then rally when the forward estimates actually come down. If that’s the case, then stocks could suffer downward pressure during March leading into the second earnings season of the year. In terms of profit margin, the index stands at 11.2%, below the 5-year average of 11.4%, and has declined since the second quarter of 2021. The forward 12-month P/E ratio is 17.7, below the 5-year average of 18.5 but above the ratio of 16.7 at the end of 2022. Among the companies that issued forward guidance for the earnings season Q1 2023, 78% issued a negative EPS guidance, well above the 5-year average of 59%. Analysts expect earnings decline of -5.7% and -3.7% for Q1 2023 and Q2 2023 and a growth of 3% and 9.7% for Q3 2023 and Q4 2023, leading to a growth rate of 2.2% for the fiscal year 2023.
The earnings downturn has been driven by margin compression and decelerating but positive sales growth. This is typical of the early stages of an earnings recession: sales slow faster than costs, resulting in the initial earnings decline. The next leg is driven by sales decelerating. Here, companies typically can’t cut costs fast enough, resulting in a more dramatic deterioration in earnings. The average earnings decline amid positive sales growth has been -8% YoY vs. -12% YoY when sales didn’t just slow but dropped. Regarding this last point, we want to caution that earnings forecasts for multiple quarters ahead have shown poor accuracy over history and even more so during an uncertain macroeconomic environment.
Equity risk premium
Recently, numerous strategists have pointed out the extremely poor risk/reward conditions present in the market. However, the expected returns of the equity market are known to vary substantially depending on the assumptions that you use, the risk-free instrument that you pick, and the model that you use. In this outlook, we use the implied equity risk premium as a measure to value the S&P 500. Similar to the yield to maturity of a bond, a stock or index can be valued by setting the expected earnings equal to the current price. The return on top of the risk free rate that allows you to equate the stream of cash flows is the so-called equity risk premium. Compared to the historical equity risk premium, which measures are affected by high standard errors and assumes mean reversion, the implied equity risk premium is more dynamic, forward looking and reflects the current market conditions. Nevertheless, it is heavily reliant on a few inputs: expected earnings, a long term expected growth rate, the payout ratio, and the risk free rate.

Source: Damodaran, Bocconi Students Investment Club
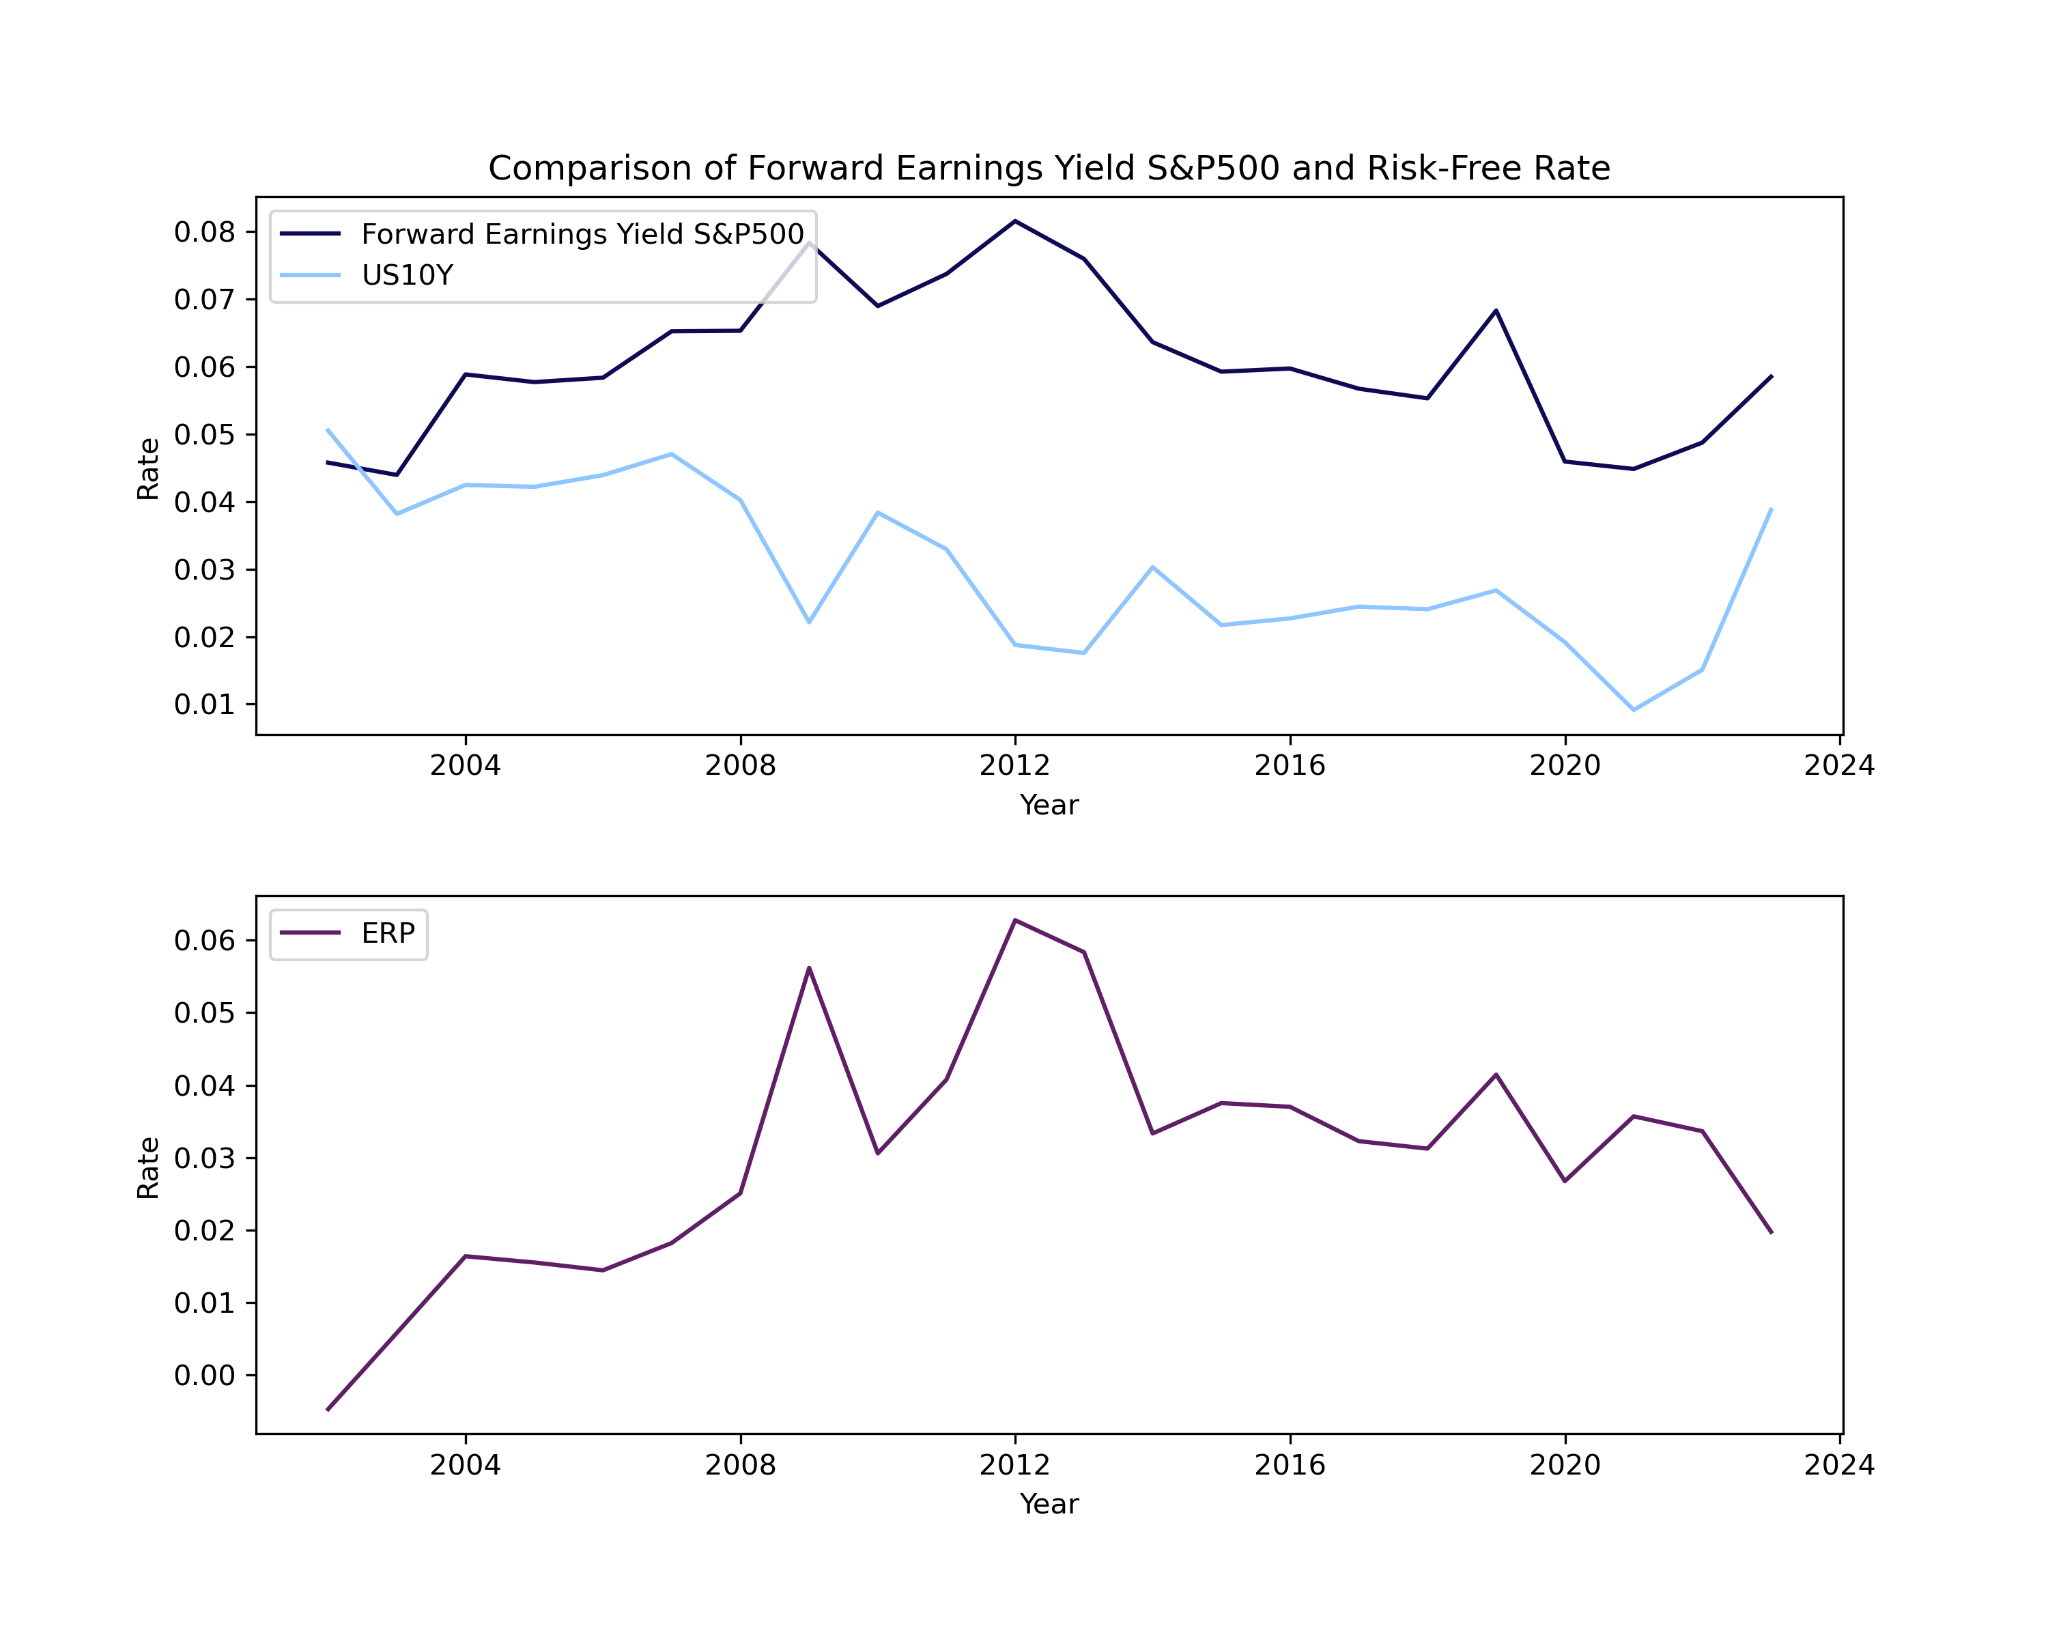
Using Damodaran’s database at NYU Stern, we can see how the current equity risk premium looks in a historical context. As of March 1, 2023, the implied ERP stands at 5.58%, in line with the average of 5.50% during the last 15 years. By adding the 10y Treasury bond rate of 4%, we arrive at an expected return of 9.50%, well above the monthly average of 7.85% since September 2008. What stands out from this time series is the sudden jump in expected return from 5.75% at the end of 2021 to 9.82% at the end of 2022, representing the largest increase in expected return tracked during the last 62 years. The surge was driven by a decrease in the index’s price and an increase in the Treasury bond rate from 1.51% to 3.88%. Despite these results being highly reliant on earnings and cash flows forecasts, if you were to argue that the S&P 500 is highly overvalued, then both the expected return and implied ERP would prove you wrong. The divergence between these results and what you might have read on the news stems from the fact that what is usually shown is the ERP computed as the forward earnings yield minus risk-free rate, the so-called expected Fed model. The actual Fed model compares the stock market’s realized earnings yield to bond yields and interprets the market as overvalued when earnings yield is below the 10-year government bond yields and undervalued when earnings yield is above the bond yields. More on the Fed model can be found here and here. Calculating ERP using the expected Fed model heavily depends on analysts’ earnings forecasts, varies heavily, and is not backed by an economic intuition such as that one behind the Implied ERP. For this reason, we prefer looking at the implied ERP.
Source: Refinitiv I/B/E/S, Bocconi Students Investment Club
SPX outlook
Looking at the forecast from strategists for the S&P 500 at the beginning of 2023, we note a range of more than 1000 points on the index, proof of the high uncertainty ahead. To face these uncertainties with conviction, one should form a macro view and find the best strategy or trades to express that view. We propose our view of how this year could play out and propose a trade that reflects our predictions in the best way possible. But before diving into our outlook for the year, let’s calculate the index value using an ERP of 5%, the average premium post-2008, and by changing some assumptions made by Damodaran in his model. Assuming that we will see an earnings recession during the second half of 2023 and 2024, we change the input in the model by reflecting earnings that will come 20% below the estimate in 2023 and a further 10% drop in 2024. Earnings in 2025 are set equal to 2022 levels, and a 10% growth rate is assumed in 2026. Long-term rates are supposed to be 2% after year 5, and the earnings growth rate is set equal to the risk-free rate in the long term. This scenario would yield an intrinsic value of the index of 3842, about 5% below Friday’s close.

Source: Damodaran, Bocconi Students Investment Club
While you could estimate an intrinsic value based on earnings and risk-free rate forecasts, investors hardly look at any fundamentals during a recession, and the price action is heavily driven by market sentiment. The main driver for the US market will be the downgrade of earnings forecast during the second half of the year. Investors have not priced in this view as the consensus expects a recovery in earnings growth starting from Q3 2023. Even though it is hard to predict how severe the recession will be, the equity market has more room to fall. As mentioned in the paragraph on market anomalies, other asset classes face the same dislocation and are proof of the opportunities present in the market based on our view. Nevertheless, we acknowledge the high probability of further bear market rallies before capitulation is reached. This possibility is very likely if incoming jobs or inflation reports come in weaker than expected.
Our trade idea:
The rally in October 2022 saw the airline sector as one of its main protagonists. Major US airline stocks experienced a 30% to 60% surge. The JETS ETF, comprising major global airlines, rose 34%. The earnings season didn’t disappoint; the industrials sector reported the second-highest earnings growth rate among all the S&P 500 at 38.2%. Boeing (BA), American Airlines Group (AAL), and United Continental Holdings (UAL) were the most significant contributors to earnings growth for the sector.
However, most of the companies in the index also reported further deterioration in profit margins, as mentioned in the Q4 2022 earnings season paragraph. While Airline companies haven’t been affected yet, as they approach an earnings recession during Q3 2023 and Q4 2023, they will experience an inevitable margin deterioration. The Airline sector is known for its razor-thin margins and for being highly sensitive to cost increases. The average profit margin for the industry is typically around 5%, and the main costs incurred are labor, fuel, and maintenance costs.
On 1st March, Delta Air Lines (DAL) approved a new contract to provide pilots a 34% raise over four years. The deal is estimated to cost the US carrier $7.2 billion over its term. The accord put extreme pressure on other companies to follow Delta’s move. Indeed, Spirits Airlines (SAVE) lifted pay rates by 34% earlier in January, United Continental Holdings (UAL) rejected a new labor agreement on 1st November, and the American Airlines pilots union rejected a proposal that would have raised pay 19% over two years. With the worsening macroeconomic scenario, these increases in labor costs across the airline sector will affect profitability and open the possibility for further downside in airline stocks.
Airline earnings have been excellent, primarily due to higher ticket prices and more volume, while capacity remained unchanged. The thesis is that if the US market enters a recession, airline companies cannot pass higher costs to consumers, and as a result, profit margins will inevitably come down. Here we think that the worse-positioned company is United Airlines. Therefore, we propose a one-leg short position on UAL. We imply around 25% downside, arriving at a target price of 40$, with our stop loss placement at 58.63$. The risk-reward is, therefore, 2.53. The timeline for this trade is around 9 months, as it will take time for sentiment to shift and an earnings recession to be priced in, as the airline industry has so far been one of the best-performing sectors of 2023.
Macroeconomic weakness leads to lower demand for air passenger travel. With larger relative customer exposure to corporate travel, United’s revenue will likely be hyper-cyclical and affected more in an economic downturn that lowers the demand for corporate flying. Fuel expenses represent a large portion of the cost structure of US network airlines. Carriers maintain little leverage to pass higher fuel prices to consumers in the short term. In addition, periods of lower fuel prices have been associated with weakening economic conditions that can typically depress overall air passenger service demand. United Airlines is seeking certain concessions during this latest round of pilot negotiations. These concessions could be more expensive than we currently estimate and provide even more downside risk. United could miss analysts’ EPS projections if labor costs from the upcoming pilot agreement rise faster than analysts expect. Increasing competition and growing industry capacity could also pressure RASM (revenue per available seat mile) as the company seeks higher-than-industry growth rates in its domestic US business.
Underlying the quarterly outlook, United flagged that January RASM is expected to be softer than the last few months due to holiday timing. However, United expects February and March RASM to trend in line with the recent performance of up ~25% vs. 2019, with management noting that the second half of February and March booked revenue is tracking 30% to 40% above the same period in 2019. Underlying the FY guide, the company’s flat RASM outlook is driven by a 2 to 3-point negative headwind from cargo and other revenues, offset by 2% to 3% year-over-year passenger unit revenue. United reported a Dec Q beat and introduced FY 2023 EPS guidance of $10 to $12 vs. consensus of $6.84 heading into the print. While guidance implies material upside to consensus, investors have expressed skepticism on the company’s revenue and fuel assumptions, mainly driving the stock’s underperformance vs. peers and the market today.
The company has below industry net margins, around 1.64%, with operating margins of around 5.71%. This means they have less buffer if labor costs increase due to labor negotiations and if volume decreases because of a recession. They ended this last quarter with a current ratio of 1, showing that at this moment in time, current assets cover current liabilities. However, it could be a better number, as debt/equity in this last quarter was 540, with total debt at 37.3bn. Furthermore, current cash doesn’t even pay for short-term debt suggesting possible fragility in its business model.
Risk factors to this thesis include better-than-expected growth in the US, not allowing the US to slip into a recession. This would allow the volume to increase, causing an increase in revenue from the group. The elevated inflation is now allowing UAL to pass costs to consumers. Another headwind for this thesis is if real disposable income for consumers grows (which is likely if the US can avoid a recession). The inflation risk brings a bifurcated outlook for the thesis: if inflation remains elevated, UAL is expected to charge higher prices, causing prices to remain elevated (increasing margins). However, if inflation remains elevated for an extended period, the Fed has much more room to raise interest rates, putting further pressure on borrowing costs and consumer spending. Given the outlook, due to a possible earnings recession, the airline industry may face severe problems in the future.


0 Comments