Introduction
In the business world, there are many words, some have strong meanings, others are buzzwords. Does the word “ESG” have a material impact in the asset management world, or is it just used as a marketing ploy? In this article, we seek to evaluate this question globally (with a focus on Europe), as well as explain how policies related to ESG can be implemented within the industry.
In addition to organizing previously known information, in the article, our team did minor quantitative research which uncovers that no correlation between the size of the assets of an AM firm and ESG performance exists. Performance is instead predicted by whether the firm is based in Europe or not: In the former case, it improves very significantly on average.
Sustainable investment forums: Evaluating global ESG policies
In order to reach the proposed ESG objective, asset management firms have to implement policies that change the way in which investments are done within their portfolios. These ESG policies can be difficult to categorize without a common frame of reference. Such a “dictionary” is fortunately provided by the Global Sustainable Investment Alliance (GSIA), which is subdivided in smaller SIF’s (Sustainable Investment Forums) across all regions of the world EX.: “Eurosif” in Europe, “Ussif” in the United States. These forums collect data within the region of interest and use terminologies shared across all SIF’s to ensure that asset management firms behaviour can be easily compared across the world.
SIF’s categorize ESG policies in the following way:
1. Negative/exclusionary screening: the exclusion from a fund or portfolio of certain sectors, companies or practices based on specific ESG criteria
2. Positive/best-in-class screening: investment in sectors, companies or projects selected for positive ESG performance relative to industry peers –Within the article we will explain what “ESG performance” usually entails-
3. Norms-based screening: screening of investments against minimum standards of business practice based on international norms, such as those issued by the OECD, ILO, un and UNICEF
4. ESG integration: the systematic and explicit inclusion by investment managers of environmental, social and governance factors into financial analysis
5. Sustainability themed investing: investment in themes or assets specifically related to sustainability (for example clean energy, green technology or sustainable agriculture)
6. Impact/community investing: targeted investments aimed at solving social or environmental problems and including community investing, where capital is specifically directed to traditionally underserved individuals or communities, as well as financing that is provided to businesses with a clear social or environmental purpose; and
7. corporate engagement and shareholder action: the use of shareholder power to influence corporate behaviour, including through direct corporate engagement (i.e., communicating with senior management and/or boards of companies), filing or co-filing shareholder proposals, and proxy voting that is guided by comprehensive ESG guidelines.
The opinion of the authors: To give an easier overview, the “strongest” policies are these which imply complete divestment (Ex. Exclusionary screening, positive screening, norms-based screening) while the “weakest” policies are these which are completely discretionary or arbitrary for the asset manager and independent of external judgment (Ex. Corporate engagement and shareholder action or ESG integration). This doesn’t mean that a “stronger” policy cannot be implemented more sloppily than a “weaker” policy and vice-versa.
GSIR and Eurosif data: the growth of sustainable investing
Disclaimer: Unfortunately the GSIA releases information biennially, so we will use slightly outdated data from 2018.
The Global Sustainable Investment Review (GSIR) shows the growth in the assets which are affected by ESG policies (as classified above) across the world. These assets will from now on be referred to as “sustainable assets”.
This data can be somewhat misleading: It is collected by the different SIF’s which might use stricter criteria for evaluating whether assets are sustainable. Notably, Eurosif adopted more stringent criteria compared to peers in 2018. In addition, for comparability sake, a measure of sustainable assets over total assets in the region is provided.
Since Europe has the largest amount of sustainable assets, and Eurosif research is available for free (Not the case for the Ussif), we focus on the European market.
The data, expressed in million euros, shows the total assets undercover by the relevant ESG policy, and the latest CAGR. These CAGR’s are quite misleading as between 2015 and 2017 the market appeared to plateau. The following table shows the 8-year CAGR’s for each available strategy
| Best in class | 20% |
| Sustainability themed | 25% |
| Norms based screening | 16% |
| Engagement and voting | 14% |
| ESG integration | N/A |
| Exclusion | 23.5% |
| Impact investing | N/A |
As can be seen, one of the most used and fastest-growing policies is the exclusionary policy, which hence warrants further investigation.
Exclusionary policy and “ESG performance” for portfolio firms
In Europe, the “topics” and “sectors” excluded as a percentage of assets under the exclusionary policy are the following
But how does exclusion work in practice? This might generate confusion. Suppose that we want to exclude the topic “Tobacco” from our portfolio. It is certainly easy to intuitively exclude firms which are entirely based on smoking, such as Philip Morris, but what about -say- retailers that sell cigarettes? In this case, an asset management firm needs to enter into contact with a specialized ESG rating firm. This firms also play a crucial role in determining “ESG performance” for equities, but for now, we will focus on explaining how their services work for the purpose of the exclusionary criteria.
The ESG rating firm provides a list of criteria and information usable for the purpose of exclusion, let’s stick to our example with tobacco! Here is a table of how these criteria might look
| Tobacco – Retailer | The recent-year percent of revenue, or maximum estimated percent, a company has derived from retail sales of tobacco products. |
| Tobacco – Retailer | Companies that retail tobacco products. |
| Tobacco – Summary | The revenue for this involvement category is estimated. |
| Tobacco – Summary | Companies that own 20 to 49.99 percent of a company with involvement. When a company owns 50 percent or more of a subsidiary with involvement, MSCI treats it as a consolidated subsidiary. |
| Tobacco – Summary | Companies that are 50 percent or more owned by a company with involvement. |
| Tobacco – Summary | The total recent-year revenue (USD), or maximum estimated revenue, a company has derived from tobacco-related business activities. |
| Tobacco – Summary | The recent-year percent of revenue, or maximum estimated percent, a company has derived from tobacco-related business activities. |
| Tobacco – Summary | Companies that have an industry tie to tobacco products through the distributor, licensor, retailer, supplier, or ownership categories. |
| Tobacco – Supplier | The revenue for this involvement category is estimated. |
| Tobacco – Supplier | The recent-year percent of revenue, or maximum estimated percent, a company has derived from supplying products essential to the tobacco industry. |
Such information will then be used to completely avoid firms which cross certain tresholds or hold certain characteristics as described by the information that the rating agency produces.
As mentioned, ESG rating agencies also evaluate, each with their own methodology, ESG scores for firms. These scores are then compared within the industry and form the basis for both the “best in class” methodology and “ESG integration” (In the first case investments are done exclusively on the advice of the rating agency, while in the latter it is mixed with proprietary systems)
ShareAction data: the ESG component in Asset Managers
But does this increase in sustainable assets translate to an actual improvement in ESG performance of asset managers? In this section, we will conduct a quantitative analysis based on a recent study done by ShareAction, an NGO which ranks asset managers. Their methodology consists in a survey, the collection of voting records and publicly available information, to make up 4 scores: “Responsible investment governance”; “Climate Change”; “Human Rights” and “Biodiversity”. These scores are then averaged with different weights to produce an ESG general rating, ranging from 0 to 100. The funds considered are the 75 largest ones.
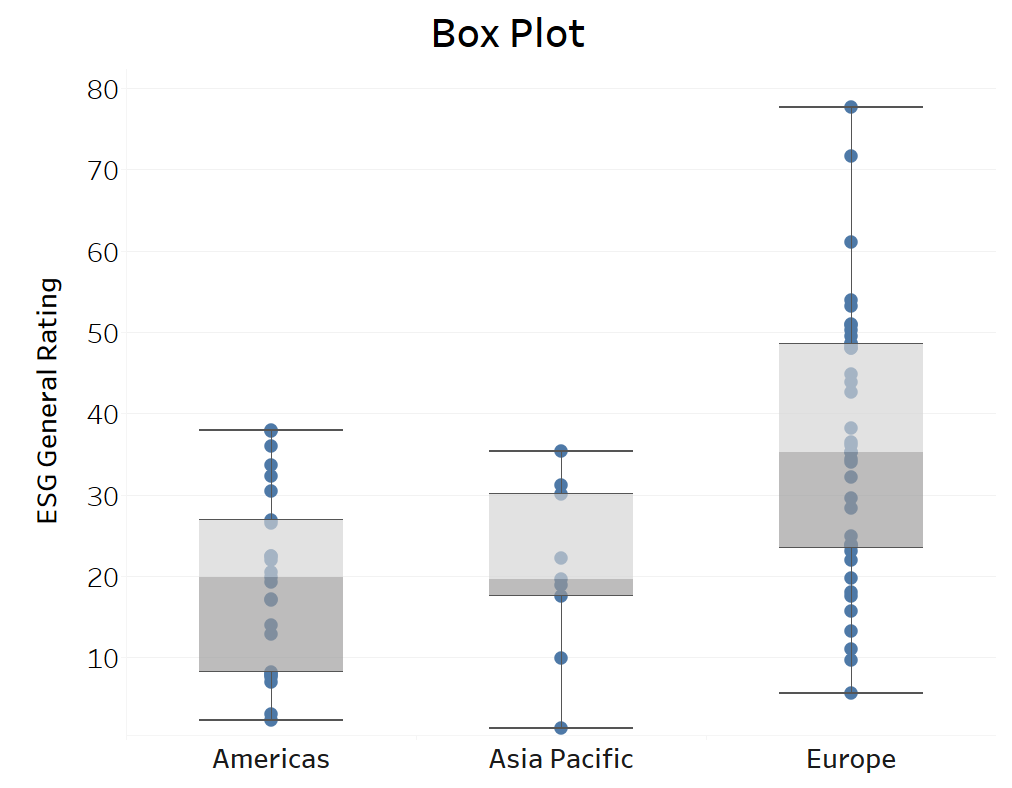
Looking at the first graph, we can see the distribution of the selected funds across the globe, and their respective AUM. In the second figure, one would probably notice a considerable difference in the ESG Rating between the asset managers from Europe and the ones from Asia Pacific or Americas, with a plus for the former. Thus, it denotes an additional level of investment responsibility for the European counterparties, whereas North America is lagging, as expected from the data provided by the SIF’s.
| Number of asset managers and total AUM (US$ trillion) across regions | Box Plot |
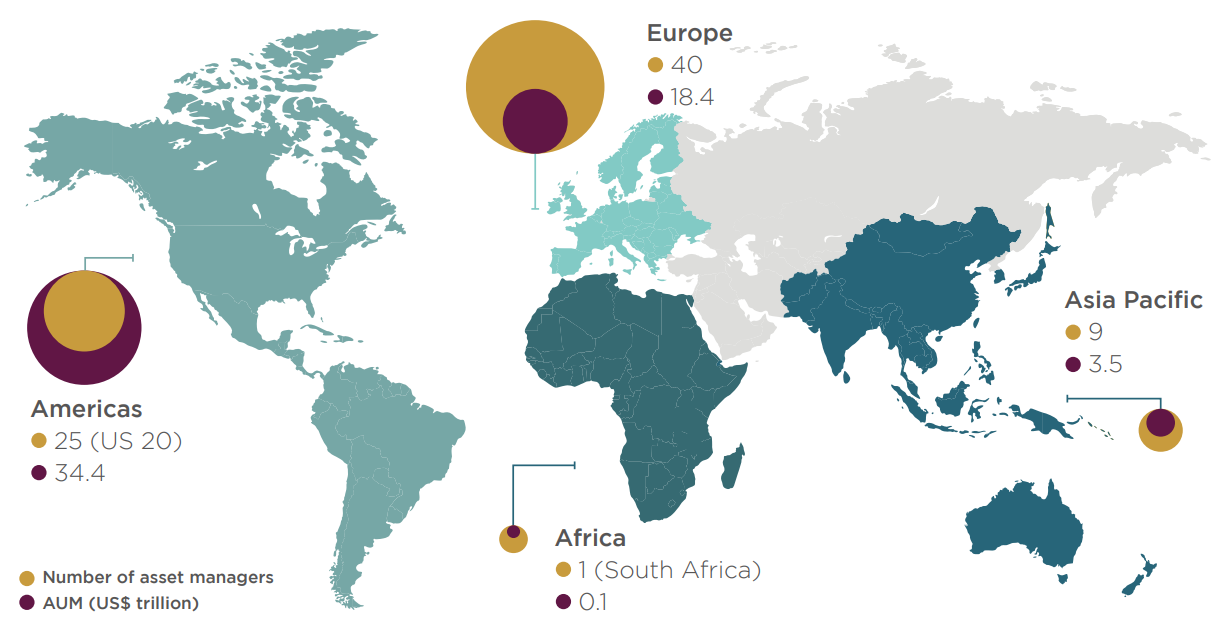 Source: ShareAction Source: ShareAction |
 |
Top 5 of the world’s largest asset managers with performance heatmap across responsible investment themes
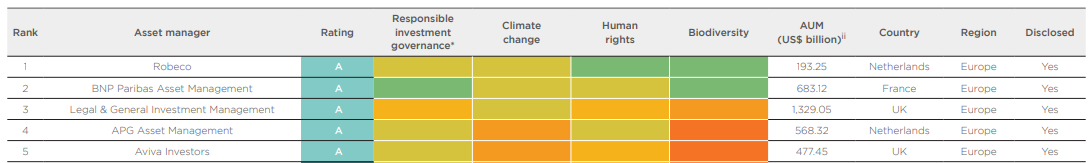
Source: ShareAction
We built a model that explains the relation between the regions, disclosure (If the firm was willing to participate in the survey provided by ShareAction), AUM – explanatory variables-, and the ESG indicator (the weighted average of the 4 scores) as response variable. To better explain this connection, we constructed new dummy variables for the country and the disclosed information, differentiating by European vs. non-European countries.
After building the regression, the results of which can be visualized below, we can infer that, as expected, European asset managers are predicted to perform much better. Curiously, no statistically significant relationship between AUM and ESG score is recorded, meaning that its not harder for the larger funds to potentially follow ESG guidelines.
| Regression Summary |
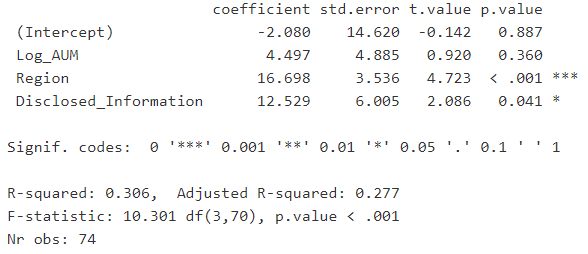 |
Indeed, the fact that the six largest asset managers have poor scores can be mostly explained by the fact that these are USA based firms.
Finally, according to the full report provided by share action, no significant correlation between the main asset class (ex. Fixed Income vs Equities) of the manager and ESG rating exists.
Qualitative analysis of fund/AM ESG performance
To conclude our analysis we conduct direct research based on the information disclosed by firms and MSCI ESG ratings.
The table below presents an overview of the ESG activity from the top, middle, and last 3 companies, based on the ShareAction ranking. It is significant to mention that the evaluation has been based on randomly chosen growth funds of the 9 Asset Managers. The four points of comparison are:
1. Strictness of exclusionary criteria
2. Environmental metric Weighted average carbon intensity: An Environmental metric of evaluating the significance of carbon in the funds’ holdings.
3. Social metricSocial Safeguards: the fund exposure to UNGC violations, Severe controversies, Controversial weapons, Tobacco industry.
4. Governance metricCorporate governance: The fund’s weighted average percentage of an independent board of directors and its weighted average percentage of women on boards.
Notably, these funds do not give a full picture of the activities of an AM firm. In addition, some of the exclusionary policies were enacted following the share action report, hence any potential discrepancy between an AM ranking and perceived seriousness in ESG positioning.
Conclusion
The full scope of ESG is even larger than is captured by our article. However, we can easily answer our initial question on whether ESG is just a marketing ploy: It is not. Despite evidence of “greenwashing” in some firms, most notably Blackrock (Which, despite the famous letter from Frink, ranks quite low in the Share action table) integrating ESG into investment decisions is becoming increasingly common, especially in Europe, where the market appears to be particularly mature: these decisions have material and measurable effects in asset composition, as evidenced by the SIF’s and our research.


0 Comments