Introduction
Europe has entered the 2026/27 winter with less gas in storage than at any point in more than a decade. The war with Iran then cut LNG exports from Qatar, and for most of the summer the forward curve gave companies no reason to refill, so by late October storage had only reached about 75%. In the same week, the front-month TTF contract rose above €100/MWh for the first time since December 2022. This article explains how Europe ended up in this position and what it means for prices. We start with how storage works: why Europe needs it, who fills it and why, and how the rules introduced after 2022 changed that. We then look at supply, focusing on Europe’s growing dependence on LNG and on competition with Asian buyers, and at demand, using ENTSOG’s winter scenarios to show how far the system can stretch under different weather and supply conditions. The final part looks at what the TTF curve is pricing for this winter and next summer.
Part I: Europe’s Gas Storage. What It Is, How It Works, and Why It Matters
Why Europe has to store gas
Europe uses most of its gas in winter, when it heats homes, while it receives gas at a fairly constant pace all year round. The seasonal swing is large. In July 2025 the EU consumed 17.4 bcm of gas, while in November 2025 it consumed 33.8 bcm, so a cold month uses almost twice as much gas as a summer one. Supply does not follow this pattern. Norwegian pipelines have little room left to raise winter flows, and because LNG supply is stable over the course of the year, it is not sufficient to allow for seasonal flexibility.
For a long time Europe did not have to think about this, because the flexibility came from supply itself. The Groningen field in the Netherlands could be turned up in winter and down in summer, and before 2013 the Netherlands provided a seasonal swing of 6-7bn m3 of monthly output from the highest winter production month to the lowest summer production month. Russian pipeline deliveries also adjusted to European demand. Both sources are now gone. Groningen was capped and then closed after the earthquakes its production caused, and Russian pipeline gas to the EU has shrunk to a residual flow. The job of matching a seasonal demand with a flat supply has fallen almost entirely on storage.
Storage also does a second job in covering the coldest days. Germany’s pipeline and LNG import capacity can bring in about 3 TWh of gas a day, but on very cold winter days, German demand could reach 6 TWh per day. Storage facilities would have to supply the difference. Over the winter as a whole, gas storage facilities account for around 30% of the EU’s gas consumption during the winter months. That is the share of Europe’s winter supply that depends on decisions taken the previous summer.
Where the storage is and who owns the gas
The EU can store about 1,133 TWh of working gas, roughly a third of what it consumes in a year. That capacity is concentrated in a few countries: storage capacities in five countries (Germany, Italy, France, the Netherlands and Austria) make up two thirds of the EU’s total capacity. Germany alone holds about a fifth of the EU total, so the German fill level weighs heavily on the European average and on the price at the Dutch TTF hub, which is the European benchmark.
The countries also differ in how much they leave to the market. Italy keeps a strategic reserve of about 4.5 bcm that is not normally used, and France obliges gas suppliers to hold enough gas in storage for a large part of their customers’ winter needs. Germany and the Netherlands traditionally left filling to commercial decisions. That difference explains a lot about where storage is low today.
An important detail is that the companies operating the storage sites usually do not own the gas inside them. Utilities and traders rent space and decide when to inject and when to withdraw. In 2021 Gazprom controlled a significant share of European storage and, ahead of that winter, left its sites almost empty. According to the European Commission, in 2021, Gazprom owned or operated around 10 per cent of EU storage capacity, and its sites were filled to only 26% in November 2021. Europe entered that winter with storage far below normal, with a meaningful part of its buffer in the hands of the supplier it was trying to become less dependent on. This episode is the origin of today’s EU storage rules
The Economics of Filling Gas Storage
Outside of regulation, storage is filled for one reason: it is profitable. A trader who rents storage buys gas for summer delivery, sells the same gas for winter delivery at the same time, and keeps it underground in between. If winter gas is more expensive than summer gas by more than the cost of storage (injection fees and the interest on the money tied up in the gas), the trade locks in a profit. The value of storage is roughly the winter price minus the summer price minus these costs. On top of this, a fast site has extra value because its owner can trade day-to-day price swings, injecting on cheap days and withdrawing on expensive ones.
In its simplest form, the relationship is:

Where  is the winter futures price and
 the summer futures price (both in €/MWh),
 is the interest rate,
 is the time the gas is held in storage (in years),
 is the cost of storage per MWh (capacity, injection and withdrawal fees), and
 is the convenience yield. The convenience yield is the value of having physical gas available now rather than later. It is small when supply is comfortable and becomes large when the market is short of gas today.
Rearranging the same expression gives the margin a trader locks in by filling storage:

In a normal year winter demand is higher, the convenience yield is low, and winter trades above summer. With summer gas at €30/MWh and winter at €37/MWh, for example, a trader paying €0.80/MWh in fees and 3% interest over six months (about €0.45/MWh) locks in a margin of roughly €5.75/MWh. However, at the end of March, summer 2026 gas traded at €50.35/MWh and winter 2026/27 at €49.81/MWh, so the spread was already negative before costs. Adding an injection fee of about €0.82/MWh and financing of about €0.76/MWh (3% over six months), a company filling storage that summer would have locked in a loss of about €2.12 for every MWh stored:
 €/MWh
In such cases, governments often intervene. In 2022, Germany’s gas market operator purchased gas directly to fill the country’s storage facilities, incurring a loss that was later recovered through a surcharge on gas bills. In 2026, the Netherlands gave the state-owned company EBN a similar role, backed by a government loan facility of more than €20bn. The opposite problem can also arise: if summer and winter prices remain close for several years, storage facilities cease to be profitable and may eventually close. This happened to Rough, the UK’s largest gas storage site, which was shut down in 2017 because it was no longer economical to maintain.
The rules introduced after 2022
After the 2021 shortfall and the invasion of Ukraine, the EU decided that storage was too important to leave entirely to these price signals. Since 2022 member states have been required to fill their storage to 90% before winter. Countries with very large storage relative to their consumption, like Austria, face a lower requirement, and countries without storage have to hold gas in their neighbours’ facilities.
The rule worked, but at a high cost. In the summer of 2022 every European country was trying to buy gas at the same time, against a hard 1 November deadline, and sellers knew it. Prices reached record levels, and ACER estimates that the 2022 refill cost around €100bn. The European Commission later acknowledged the problem, arguing that speculation surrounding the existing mandatory 90% fill rate target by Nov. 1 each year was driving the cost of refilling during the summer.
The rules were loosened in 2025 and extended to the end of 2027. The 90% target can now be reached at any point between 1 October and 1 December, and countries can miss it by up to 10 percentage points in difficult market conditions, with the Commission able to grant 5 more. In practice the floor is now around 75%. Germany went further on its own and cut its national targets to 80% for salt caverns and 45% for most of its old gas fields. The intention was to stop markets from treating storage targets as a guaranteed buyer. The side effect, visible this year, is that when the market has no reason to fill storage, the rules no longer force it to.
How storage levels have moved
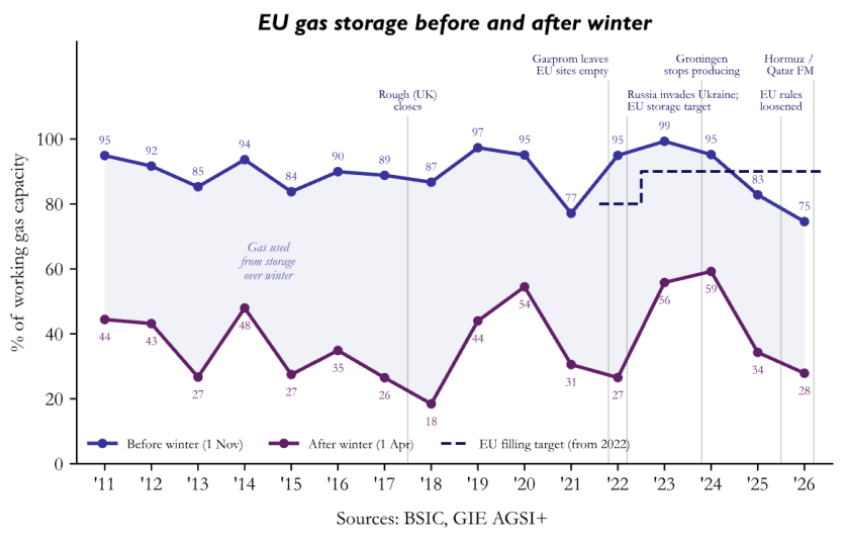
Before 2021, without any targets, Europe typically went into winter with storage around 90% full and came out with roughly a third left. That was enough because supply could still flex. The 2021/22 winter broke the pattern: storage started at about 76% and ended at 26%, with Gazprom’s empty sites accounting for much of the gap.
The next three years went the other way. The new obligation, combined with two mild winters, kept storage close to full: it peaked above 99% in autumn 2023 and ended the 2023/24 winter at a record 58%. Europe began each refill season with more than half its storage still full.
That cushion disappeared quickly. A colder 2024/25 winter left storage at about a third by spring 2025, Europe went into the following winter at 83% rather than 90%, and that winter ended at just 28% in April 2026, the lowest starting point for a refill in years. Now in 2026 storage reached 72% on 1 October and about 75% by late October, which is the lowest seasonal level since records began in 2011.
How European gas is traded
Until the 2000s, most gas in continental Europe was bought under long-term contracts with prices linked to oil products. Since then, contracts have moved to hub pricing: the buyer pays the price quoted at a gas trading hub, usually the Dutch TTF, plus or minus a fixed amount. In north-west Europe, 95% of gas was priced against other gas by 2019 and only 5% against oil. Oil-linked contracts remain mainly in southern Europe, where Spain and Turkey are the largest oil-indexed importers.
A European gas hub is not a physical place. Each national gas network has a virtual trading point, run by the network operator, where ownership of gas inside that network can change hands. Gas enters the network through a border pipeline or an LNG terminal. The main hubs are TTF in the Netherlands, THE in Germany, PEG in France, PSV in Italy, PVB in Spain, CEGH in Austria, ZTP in Belgium and NBP in Britain. THE was created on 1 October 2021 by merging Germany’s two market areas, Gaspool and NetConnect Germany. Continental hubs are quoted in euros per MWh and NBP in pence per therm. US gas (Henry Hub) and international LNG are quoted in dollars per MMBtu: a TTF price of €100.20/MWh is about $32.5/MMBtu.
Part II: European Gas Supply
Where Europe gets its gas
Europe produces only a small part of the gas it consumes. In 2025, EU production was about 33 bcm, enough to cover around 10% of consumption. Most of the rest had to come from abroad, either through pipelines or on ships carrying LNG. The EU imported 158 bcm through pipelines and 131 bcm as LNG that year, so the split between the two was roughly 55% and 45%. Four years earlier, pipelines had accounted for about 80% of imports. This change helps explain why a market that once depended mainly on a few neighbouring suppliers now reacts so strongly to events in the US and Asia. The two forms of supply reach Europe in different ways. Pipeline gas travels through an existing connection between the producer and the buyer’s network. LNG must first be cooled into a liquid, loaded onto a ship and then turned back into gas at an import terminal. Once inside the European network, both can be consumed or put into storage. The difference is in how they get there, and in how easily another delivery can be arranged when Europe needs more gas.
A country’s LNG demand depends on:

Behind these national flows are companies that produce, market and buy the gas. On the pipeline side, important suppliers include Equinor in Norway, Sonatrach in Algeria, SOCAR in Azerbaijan and Gazprom in Russia. Norway mainly supplies continental Europe and the UK through pipelines, although it also exports LNG. Equinor markets around 70% of Norwegian continental shelf gas production, including volumes sold on behalf of the Norwegian state, and supplies LNG from the Snøhvit field. Russia also uses both routes: pipelines serve China, Türkiye and its remaining European customers, while LNG reaches buyers in Europe and Asia. The ability to redirect pipeline gas depends on the connections available, whereas LNG can reach a wider range of destinations by sea.
What changed after Russian supplies fell
For years, Europe could rely on large Russian deliveries while its own production declined. That arrangement began to break down before the invasion of Ukraine. Russian pipeline flows to Europe fell by around 25% year on year in the final quarter of 2021, while Gazprom left much of the storage it controlled unfilled. Further cuts followed in 2022, including the loss of the Yamal route and Nord Stream deliveries. By 2025, Russian pipeline imports into the EU had fallen to 18 bcm, from 137 bcm in 2021. Europe had to find other suppliers at the same time as it was losing the buffer that could have made the adjustment easier. Other pipelines could replace only part of the missing gas. Norway increased deliveries and became the EU’s largest external supplier, providing 89.3 bcm, including LNG, in 2025, or about 31% of imports. But producing more gas requires spare capacity at the fields, processing plants and pipelines. Higher prices give suppliers a reason to increase output; they do not make that capacity appear. In 2022, Norwegian pipeline deliveries to Europe increased by only about 4 bcm and Azerbaijani deliveries by about 3 bcm, while combined deliveries from Algeria and Libya fell. These changes were too small to cover the Russian shortfall. Europe therefore had to buy more LNG and use less gas. By 2023, lower consumption and high storage levels had helped bring prices down, even though supply remained below its pre-invasion range. New import terminals and additional connections between countries also made it easier to move gas to where it was needed. The market became less strained because Europe needed less gas and could distribute its imports more effectively. It had not recovered the supply flexibility it previously enjoyed.
The remaining Russian routes have continued to shrink. Transit through Ukraine stopped on 1 January 2025, removing a route that the IEA estimated had supplied around 15 bcm annually to Europe. The EU’s Russian gas phase-out regulation, adopted in January 2026, will also end the remaining imports. Deliveries under existing long-term Russian LNG contracts will be banned from 1 January 2027, followed by pipeline deliveries under long-term contracts from 30 September 2027. The pipeline deadline can be postponed to 1 November in a member state if the European Commission confirms that it risks missing its storage-filling target. Europe will therefore have to replace those supplies while already competing for scarce LNG. However, banning Russian gas from Europe does not necessarily remove it from the global market. Russian LNG may be redirected to buyers elsewhere, reducing their need for other cargoes and freeing those supplies for Europe. How much this offsets Europe’s replacement needs will depend on shipping costs, contractual restrictions and buyers’ willingness to switch suppliers.
Why LNG makes Europe depend on other buyers
LNG offers a way to replace pipeline gas because ships can bring supplies from producers that have no direct connection to Europe. The EU expanded its annual LNG import capacity by 76 bcm between 2021 and 2025, reaching 242 bcm. That gives it more places to unload cargoes. The cargo must first be produced at an export plant, and another buyer may be willing to pay more for it.
Global LNG production is itself concentrated in a small number of countries. According to the EIA, the US, Qatar and Australia together supplied approximately 63% of global LNG exports in 2025. Their importance to Europe is larger than direct trade alone would suggest. Australian cargoes sold to Asian buyers, for example, can reduce those buyers’ need to compete for Atlantic supplies. Conversely, a disruption at an exporter serving mainly Asia can push Asian customers towards cargoes that Europe also needs. This is where Asia becomes important. A seller with a flexible cargo can compare what it would earn by delivering to Europe with what it would earn in Asia. If the Asian price is sufficiently higher to cover the difference in transport and delivery costs, the cargo has a reason to go there. European buyers may then have to raise their bids to keep it. The link between TTF and the Asian JKM benchmark comes from this competition for supplies that can serve either market.
A country’s LNG demand is the amount it still needs after domestic production, pipeline imports and adjustments such as storage withdrawals. China, for example, can use more gas without importing more LNG if its own output or pipeline deliveries increase sufficiently. The EIA reports that Chinese LNG imports fell by 15% in 2025 as pipeline imports and domestic production took a larger share of its gas market. That left China needing fewer cargoes from the same international market on which Europe increasingly relies. It is therefore the change in this remaining import requirement, rather than consumption alone, that matters for competition with European buyers. The price of those additional cargoes can also influence gas that reaches Europe through pipelines. If existing pipeline deliveries and domestic output are not enough, Europe must pay enough to attract LNG or reduce consumption. A Norwegian producer selling at the hub can receive that same market price; its gas does not have to pass through an LNG terminal to be affected. This is why LNG can have a large influence on TTF even when it accounts for less than half of imports.
How US supply affects Europe
The US has become central to this adjustment. Its LNG contracts often allow buyers to choose the destination, making those cargoes useful when supply needs to move between markets. Many contracts link the cost of the gas bought for liquefaction to approximately 115% of Henry Hub, the US benchmark, with liquefaction charges added. Shipping and regasification add further costs before the gas reaches Europe. Cheap US gas can therefore help European buyers, provided there is enough export capacity to turn it into LNG and send it across the Atlantic. That last condition explains why Henry Hub and TTF can move in opposite directions. When an American export plant stops operating, it buys less gas from the US network. More gas remains available to domestic customers, putting downward pressure on the US price. At the same time, Europe and Asia have fewer cargoes to buy. This happened at Freeport in June 2022: the shutdown removed around 2 Bcf per day of export capacity, and Henry Hub fell as US export demand weakened. For European buyers, the interruption made the search for replacement supply harder. New export plants can ease that constraint. Global LNG production rose by almost 7% in 2025, with most of the increase arriving in the second half of the year. The Plaquemines plant in Louisiana alone accounted for more than 60% of the annual increase. As supply grew, market conditions eased, and TTF prices in the second half of 2025 were 14% below the same period a year earlier.
Why the 2026 disruption reached Europe
The war with Iran quickly changed the picture. Ras Laffan supplied only around 8% of Europe’s LNG imports but accounted for about 18% of global LNG supply. When Qatar halted production in early March, European gas prices rose by 52%, their largest increase since Russia’s invasion of Ukraine. Europe’s exposure extended beyond the Qatari cargoes it bought directly. Asian customers that had relied on Gulf deliveries needed replacement supplies and competed for US and other Atlantic cargoes that might otherwise have reached Europe. The pressure came from Asia’s increased need for replacement LNG, rather than necessarily from higher gas consumption. The scale of the disruption overwhelmed the growth in supply elsewhere. Between March and October 2026, LNG loadings from Qatar and the UAE fell by more than 60 bcm compared with a year earlier. Producers outside the Gulf added more than 40 bcm, replacing only around two-thirds of the missing volumes. The IEA’s November assessment projected global LNG supply to fall by 3% in 2026 if flows through Hormuz remained largely disrupted through year-end, compared with the growth of more than 7% it had expected in January. Buyers were therefore competing for a smaller supply pool in a year that had been expected to bring relief. Damage to Qatar’s liquefaction facilities also prolonged the problem: reopening the shipping route would not restore production from plants still awaiting repair. For Europe, the result was fewer LNG deliveries despite higher prices, EU LNG imports fell by 14% during summer 2026, with almost no Qatari deliveries. Imports from the US also fell, by about 9%, but their share of EU LNG imports rose to around two-thirds because supplies from other sources declined faster. US LNG consequently accounted for around 30% of total EU gas supply. Europe became more dependent on American deliveries even though those deliveries were insufficient to replace the volumes lost elsewhere.
The shortage also made rebuilding storage more difficult. For much of the injection season, summer gas traded above gas for the following winter. Buying gas for storage and simultaneously selling it for winter delivery would therefore have locked in a loss before storage and financing costs. Companies could still buy to meet supply commitments or storage obligations, but the seasonal spread offered little incentive for additional commercial injections. Combined with low inventories at the start of the season and reduced LNG arrivals, this left EU storage only about 75% full by late October, its lowest level entering winter in more than a decade. That smaller buffer increased Europe’s exposure to further disruptions as heating demand began to rise. On 28 October, renewed attacks on shipping around the Strait of Hormuz and outages at Norwegian processing plants pushed the front-month TTF contract above €100/MWh for the first time since December 2022. It subsequently fell back to around €85/MWh, but Europe is entering winter with both fewer available imports and less stored gas to compensate if deliveries fell further.
Part III: European Gas Demand. What Its Composition Is, How It Has Evolved and What Winter Scenarios Lie Ahead
Who consumes gas in Europe
Residential and commercial buildings, industrial activity and electricity generation are the three main sources of European natural gas demand. Although all three sectors rely on the same energy source, their consumption patterns differ considerably.
The residential and commercial sector uses natural gas mainly for space heating and hot water, making its demand particularly sensitive to weather conditions. Industrial consumption, on the other hand, is closely linked to economic activity, with gas used both to generate heat in industries such as glass and ceramics and as an input in chemical and fertiliser production. Finally, gas fired power plants use natural gas to generate electricity, with their consumption depending on electricity demand and the availability of alternative generation sources.
Because each sector uses gas for different purposes, their responses to price changes also differ. While households have limited flexibility to reduce heating consumption during cold periods, industrial producers may be more flexible in adjusting their output in response to changes in energy costs. Gas fired power generation can also respond to price changes, depending on the availability and cost of alternative generation sources.
European Gas Demand Trend and Seasonality
According to Eurostat, EU gas consumption fell from approximately 4,435 TWh in 2021 to 3,547 TWh in 2024, before recovering slightly to 3,637 TWh in 2025. Despite this recovery, consumption remains around 18% below its 2021 level. This decline reflects a combination of factors, including higher energy prices, lower industrial activity, improvements in energy efficiency and the increasing use of alternative energy sources.
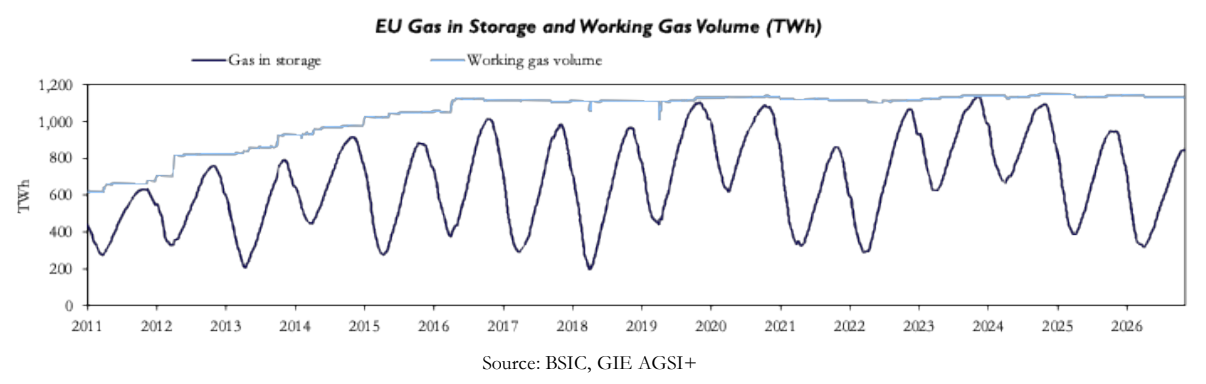
European natural gas demand remains highly seasonal, mainly because of it is widely used for residential and commercial heating. Consumption generally increases between October and March, reaching its highest levels during the winter, before declining during spring and summer. This seasonal pattern is also reflected in the evolution of the withdrawals from the underground gas storage.
Can Europe Meet Its Gas Demand?
To assess the ability of the European gas infrastructure to meet demand under different conditions and the role of the supply, we can refer to ENTSOG’s Winter Supply Outlook 2026/27. The report examines the possible evolution of gas supplies and underground storage inventories throughout the winter, identifying potential risks to security of supply under different demand and supply scenarios.
The analysis uses PLEXOS, a network optimisation model based on a capacity based approach, where gas flows are allocated across the European network while respecting infrastructure constraints. Its objective is to meet demand and achieve storage targets at minimum total system cost. The objective function includes four components: curtailment costs, penalties for missing storage targets, costs of supply and residual infrastructure costs. Curtailment is assigned the highest cost and is therefore avoided whenever possible, while non mandatory storage targets can be missed if necessary to satisfy demand. The model also assumes cooperation between European countries, without considering individual commercial supply agreements.
To test the system under different conditions, three demand scenarios are combined with different supply assumptions. The Reference Winter is based on estimates provided by national transmission system operators, while the Cold Winter considers the highest historical winter demand recorded in each country since 2009/10. Compared with winter 2025/26, these scenarios imply demand increases of 3% and 19%, respectively. A third sensitivity considers demand 15% below a historical five year average.
On the supply side, the model considers three levels of LNG availability: Optimal, based on historical import flows; Tight, assuming 20% lower availability; and High, mainly constrained by European infrastructure capacity. These are combined with two Russian pipeline supply scenarios: Minimised, where the model limits Russian gas imports through higher assumed costs, and Disrupted, where imports are completely interrupted.
Starting from the initial EU storage filling level of 72% on 1 October 2026, the model simulates the evolution of gas inventories throughout the winter. The results are presented through two main indicators: Final UGS Filling Level, measuring the remaining share of working gas capacity at the end of March 2027, and Demand Response Needs, representing the share of demand that may need to be reduced or could remain uncovered under the assumed conditions.
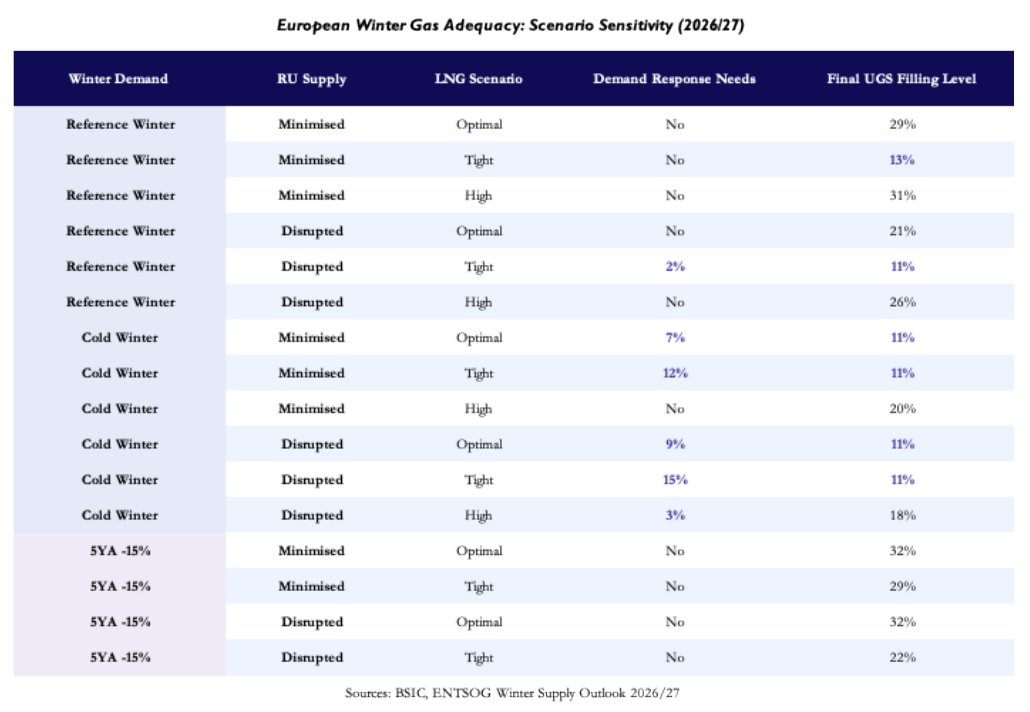
The results show that, under Reference Winter conditions and with Russian supplies minimised, European demand can be fully met even with LNG Tight availability. However, final storage levels fall from 29% under LNG Optimal to 13% under LNG Tight, showing how storage can compensate for lower imports at the expense of significantly reducing remaining inventories.
The situation changes under Cold Winter conditions. With Russian supplies minimised, demand response needs reach 7% under LNG Optimal and 12% under LNG Tight, equivalent to approximately 237 TWh and 437 TWh, respectively. In both cases, storage levels fall to 11%, corresponding to strategic reserves that are not freely available on the market under normal conditions. If Russian pipeline supplies are completely disrupted, demand response needs increase further to 15% under LNG Tight.
The sensitivity analysis also highlights the importance of LNG availability. Under Cold Winter conditions, LNG High allows demand to be fully met when Russian supplies are minimised, leaving storage at 20%. However, with Russian supplies disrupted, demand response needs rise to 3%. In contrast, under the reduced demand sensitivity, no additional demand response is required across the combinations considered.
Overall, the results show that Europe’s ability to meet winter demand depends on the interaction between weather conditions, LNG availability and storage flexibility. Under Reference Winter conditions, lower LNG supplies mainly lead to additional storage withdrawals, while under Cold Winter conditions, the same supply constraints can result in demand response needs or potential uncovered demand. This highlights the importance of maintaining sufficient storage levels and securing adequate LNG deliveries throughout the winter season.
Part IV: Curve Dynamics
Supply and demand effects
From summer 2026 to early November, the European gas curve increasingly reflected a shortage lasting beyond the initial disruption at Hormuz. At the end of June, prices were still broadly consistent with LNG flows recovering before winter. As that recovery failed to materialise, buyers had to secure winter supplies against a smaller pool of available cargoes and a weaker storage buffer. Prices rose most strongly for the heating season, but the adjustment gradually reached the following summer as well.
The change was initially visible in the premium for winter over spring delivery. The TTF Q1 2027 price exceeded Q2 by approximately €7/MWh in late June. That premium widened to €23/MWh in mid-September, before easing to around €16/MWh by 25 September. The increase in backwardation meant that gas delivered before the end of winter had become more valuable relative to gas arriving afterwards. Winter combined high heating demand with uncertain imports, while spring still offered the prospect of lower consumption and recovering LNG supply.
By 7 October, winter 2026-27 prices had risen by approximately $10/MMBtu relative to late June, while summer 2027 had increased by around $7/MMBtu. The shortage was therefore affecting more than the contracts covering peak demand. Buyers were also paying more for gas delivered during the next injection season, when depleted inventories would need to be rebuilt.
By 3 November, Q1 2027 forwards stood near €92/MWh and summer 2027 near €69/MWh. Letting  denote the price at time
 , for delivery during period
 , the winter premium was:
 €/MWh
This compares Q1 with the full summer rather than Q2 alone, but the economic meaning is similar: the market placed a substantial premium on gas available during winter while keeping summer delivery expensive. The curve allowed for conditions to improve after the heating season without pricing a return to abundant supply.
The US midterms brought a partial reversal of the rally. Selling had already begun on 2 November as hopes of mediation improved. After initially rising on 4 November, the front-month TTF contract fell to €88.19/MWh in afternoon trading, down 3.7%, and traded around €86.14/MWh the following morning. Greater optimism about diplomacy with Iran reduced some of the premium attached to further escalation. However, the fall in the nearby contract did not establish that the winter–summer spread had narrowed, nor did it replenish Europe’s inventories. It changed expectations about future deliveries before those deliveries had actually recovered.
The demand scenarios discussed above explain why prices remained sensitive to weather despite this easing. With Russian supplies minimised, Reference Winter demand can be met under both LNG Optimal and LNG Tight assumptions, but end-March storage falls from 29% to 13% as LNG availability tightens. Under Cold Winter conditions, the same supply assumptions instead require demand responses of 7% and 12%. The distinction is important for pricing: a system that can absorb missing imports through withdrawals under normal weather may need to reduce consumption when temperatures fall.
The price response can therefore become larger as the buffer shrinks. With comfortable inventories, additional heating demand can be met by withdrawing more gas. With low stocks and constrained imports, the same demand increase requires more expensive replacement cargoes or prices high enough to discourage consumption elsewhere. Households have limited immediate flexibility during cold spells, leaving industry and power generation to provide more of the adjustment. Low wind output can make this harder by increasing gas-fired generation at the same time as heating demand rises. A colder forecast can consequently lift both the contracts covering the cold spell and later winter contracts, because more gas is expected to have been withdrawn before those later periods begin.
Storage carries this pressure into summer. In a simplified seasonal balance:

where  represents inventories,
 total supply over winter, and
 consumption, net exports and losses. All quantities are measured in the same energy units. Holding other factors unchanged, an additional unit of winter consumption reduces closing inventories by the same amount as one fewer unit of imports.
For a given stock target before the following winter, the required net injections are:

A colder winter or weaker LNG arrivals therefore increase summer purchasing needs even if heating demand subsequently returns to normal. Europe must buy gas for current consumption and replace the volumes taken from storage. A mild winter works in the opposite direction: it lowers immediate demand and preserves inventories, potentially reducing prices for both winter and the next refill season.
This helps explain why early-November expectations still pointed to a difficult spring balance. A central storage scenario left inventories in the high teens to low twenties as a percentage of capacity at winter’s end. The range of possible price outcomes was much wider: pre-election scenarios placed Q1 gas near €150/MWh if Gulf exports remained at only 25-30% of normal through March alongside colder weather, compared with around €45/MWh under warmer conditions and improving supply. These are conditional estimates, but they show why small changes in the expected combination of weather and LNG availability can produce large price movements.
The refill requirement also affects the incentive to store gas. A simplified margin on buying summer gas, storing it and selling winter delivery is:

with costs expressed per MWh and physical losses omitted for simplicity. If heavy withdrawals raise summer purchasing needs while buyers expect supply to improve by the following winter, summer prices can rise relative to winter prices and compress this margin. Europe can then need more gas in storage while the seasonal spread offers less reward for putting it there. The Q1 2027 premium over summer does not solve that problem: gas injected next summer must be sold against the winter that follows it.
By early November, the curve had therefore moved through two adjustments. The prolonged disruption first raised winter prices and extended the pressure into summer 2027. Diplomatic hopes then reversed part of the rally, while low inventories kept prices exposed to weather and the timing of returning cargoes. From here, a narrowing winter–summer premium could mean that stronger imports or milder weather are pulling winter prices down. It could also mean that delayed supply recovery and a larger refill requirement are pushing summer prices up. The spread alone cannot distinguish between relief arriving sooner and the shortage lasting longer.
The March/April Spread
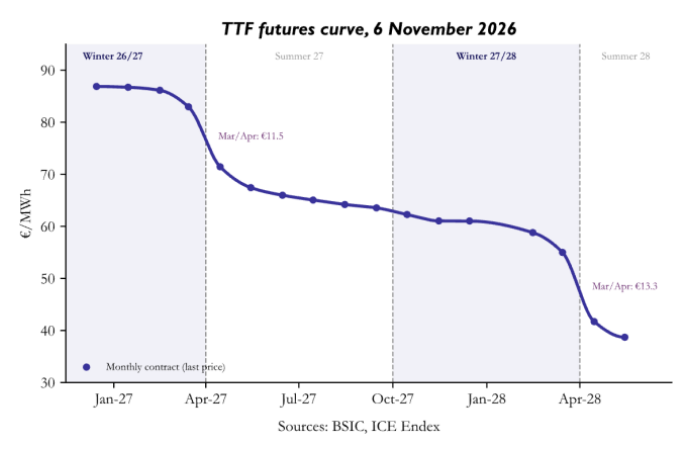
The March/April spread is the price of gas in the last month of winter minus the price in the first month of summer. On 6 November the March 2027 contract traded at €82.97/MWh and April at €71.45, a gap of €11.50, or 16% of the April price. The step is also sharp: January to March falls by under €4 and April to June by about €5.5, so nearly all of the drop between the winter and summer quarters comes on 1 April. Recent winters give a sense of scale. In November 2023, Q1-24 traded at €47.89 against €46.35 for summer 2024. A year later, Q1-25 was at €47.6 and summer 2025 at €45.35. In October 2025, Q1-26 was at €31.05 and Q2-26 at €29.10. In each case the end-of-winter premium was €1.5-2.3, or 3-7% of the summer price. Today’s equivalent, Q1-27 over Q2-27, is €16.7, or 24%. The premium has also moved a lot this year. Q1-27 and Q2-27 stood at €39.38 and €32.70 on 25 June, €81.02 and €58.02 on 14 September, and €68.35 and €53.50 on 29 September, so the gap went from under €7 to €23 and back to about €15 before settling near €17
The spread is wide this year because storage is expected to be nearly empty in March. As we explained above storage could be 17-20% full or lower by the end of March, and withdrawal rates tend to slow once storage falls below 30% of working capacity. In March, then, extra gas has to come from LNG bid away from Asia or from cuts in demand, while April already benefits from the fall in heating demand. The spread can’t widen without limit, though, because a near-empty system has to refill through summer 2027, which keeps April expensive. When the winter sold off in late September, Q1 fell almost three times as much as Q2. When the October rally showed that the supply shortfall would last, both legs rose almost together.
Part V: Germany’s Strategic National Gas Reserve
According to a leaked draft from the economy ministry, Germany wants to scrap its national storage filling targets when they expire at the end of March 2027 and replace them with a strategic national gas reserve. The current targets are about 70% by November and 30% by February. The reserve has a narrow purpose: to cushion supply crises and prevent, or at least delay, state intervention once the regulator (BNetzA) declares a shortage. It is sized to cover 30 days of supply if the regular infrastructure fails. The draft mentions a target of 24 TWh without making it binding, which is about 2.5 bcm, or around 10% of German storage capacity. THE, the market area manager, would buy the gas based on its own risk assessments, while BNetzA would decide when to release it. Purchases would be spread over two to three years, starting in summer 2027 to avoid impact on prices. A new levy would pay for it from October 2027, estimated at €0.29-0.36/MWh on consumption, or roughly €247-308m a year over the first ten years.
Klaus Müller, head of the regulator, has said the binding filling targets proved cumbersome and can distort the market, and suggested a strategic reserve as an alternative. This is linked to the issues we described at the start: fixed targets turned storage into a forced buyer in 2022, so Germany cut them in 2025. With weak targets, 2026 showed the market won’t fill storage when the curve is inverted. Germany is at 61.7% against an effective target of about 70%, and in September the government had to order the state-owned importer SEFE to speed up filling. The reserve tries to get both things: let the market decide most of the filling, but keep a guaranteed emergency stock in state hands. Austria, France and Poland already run systems like this, and Germany has also been pushing for the EU to replace its own targets after 2027 with nationally managed reserves.
How the Reserve Could Affect Prices and Storage
The strategic reserve would guarantee a relatively small volume under state control, while traders and suppliers would remain responsible for normal winter procurement. Germany can allow its national site-specific filling targets to expire in March 2027, but it will remain subject to the EU storage framework until the end of that year. During 2027, the reserve would therefore operate alongside the European obligation. Beyond 2027, more of Germany’s commercial storage could again be filled according to customer commitments, import availability and the seasonal price spread.
Building the reserve would create additional demand during the injection season. If the reference volume of 24 TWh were purchased evenly over two to three years, THE would acquire approximately 8-12 TWh annually. This is small compared with the EU’s 1,133 TWh of storage capacity, but the purchases would come from a buyer whose mandate does not depend on whether storage is commercially profitable. In a tight refill season, this buying could support summer prices and reduce the margin between summer delivery and the following winter. Even if spreading purchases over several years is intended to limit that effect.
The reserve could also affect private storage activity. Reserving approximately 24 TWh would place close to 10% of German storage capacity outside normal commercial use. Long-term state bookings would provide stable revenue to the selected storage operators and could help keep economically marginal facilities open. At the same time, less capacity and withdrawal flexibility would remain available to traders. If private companies respond by holding less gas of their own, part of the public reserve would replace commercial inventories rather than add an equal amount to Germany’s total crisis buffer.
The release conditions are going to be the most interesting point. BNetzA argues that the reserve should be used only after the emergency level has been declared and federal gas allocation has begun. Under such a strict rule, it would not place a ceiling on TTF prices. Its main benefit would instead be to reduce the risk that a sudden infrastructure failure immediately caused industrial curtailment, giving Germany time to repair infrastructure or arrange alternative imports. The effect would be different if future governments were allowed to release the gas simply because prices had become politically uncomfortable. Traders could then treat the reserve as a potential source of supply during a price spike, reducing part of the winter risk premium. However, this would also weaken incentives to hold private inventories because companies would expect the state to intervene when the market tightened.
References
[1] Gas Infrastructure Europe, “AGSI+ Aggregated Gas Storage Inventory”, GIE, 2026
[2] Bundesministerium für Wirtschaft und Energie, “Gasspeicherfüllstandsverordnung (GasSpFüllstV)”, BMWE, 2025
[3] Clean Energy Wire, “Energy Industry Welcomes Plans for National Gas Crisis Reserve, Germany Calls for Better Design”, Clean Energy Wire, 2026
[4] ENTSOG, “Winter Supply Outlook 2026/27”, ENTSOG, 2026
[5] ENTSOG, “Winter Supply Outlook 2013/14 and Winter Review 2012/13”, ENTSOG, 2013
[6] Eurostat, “Supply, Transformation and Consumption of Gas (nrg_cb_gas) and Heating Degree Days”, Eurostat, 2026
[7] ACER, “Gas Market Monitoring Data (CHEST)”, European Union Agency for the Cooperation of Energy Regulators, 2024
[8] Oxford Institute for Energy Studies, “What Next for Hormuz LNG?”, OIES Energy Comment, 2026
[9] Dart, Samantha, “Goldman Lifts Natural Gas Price Forecasts on Supply, Weather Uncertainty”, Investing.com, 2026
[10] Euronews, “European Natural Gas Prices Soar: What It Means for Your Winter Bills” (Wood Mackenzie outlook), Euronews, 2026
[11] Argus Media, “TTF Gas Price Spike Spills into 2027 and Beyond”, Argus, 2026
[12] Patterson, Warren and Manthey, Ewa, “The Commodities Feed”, ING Think, 2026
[13] Timera Energy, “European Gas Seasonal Spreads Move Back Toward Positive Territory”, Timera, 2026
[14] KYOS, “Gas Storage and Swing Report No. 36”, KYOS Energy Analytics, 2022
[15] MNI Market News, “Time Spreads Edge Wider as Front Month Falls”, MNI, 2023
[16] MNI Market News, “TTF Lower as Storage Withdrawals Return to Near Normal”, MNI, 2024
[17] TotalEnergies Market Access, “Point Marché Hebdo”, TotalEnergies, 2025
[18] Steves, Rick, “TTF Gas Price Prediction: €92 Bull Case vs €46 Bear”, The Traders Spread, 2026
[19] ICE Endex, “Dutch TTF Natural Gas Futures: Contract Specifications and Market Data”, Intercontinental Exchange, 2026


0 Comments