A persisting trend
DISCLAIMER: The EURUSD pair is an exception to general FX notation. We comply with the quoting convention adopted in the industry: when the Dollar strengthens against the Euro, EURUSD moves lower, and vice versa. For charting purposes, however, we use the USDEUR time series.
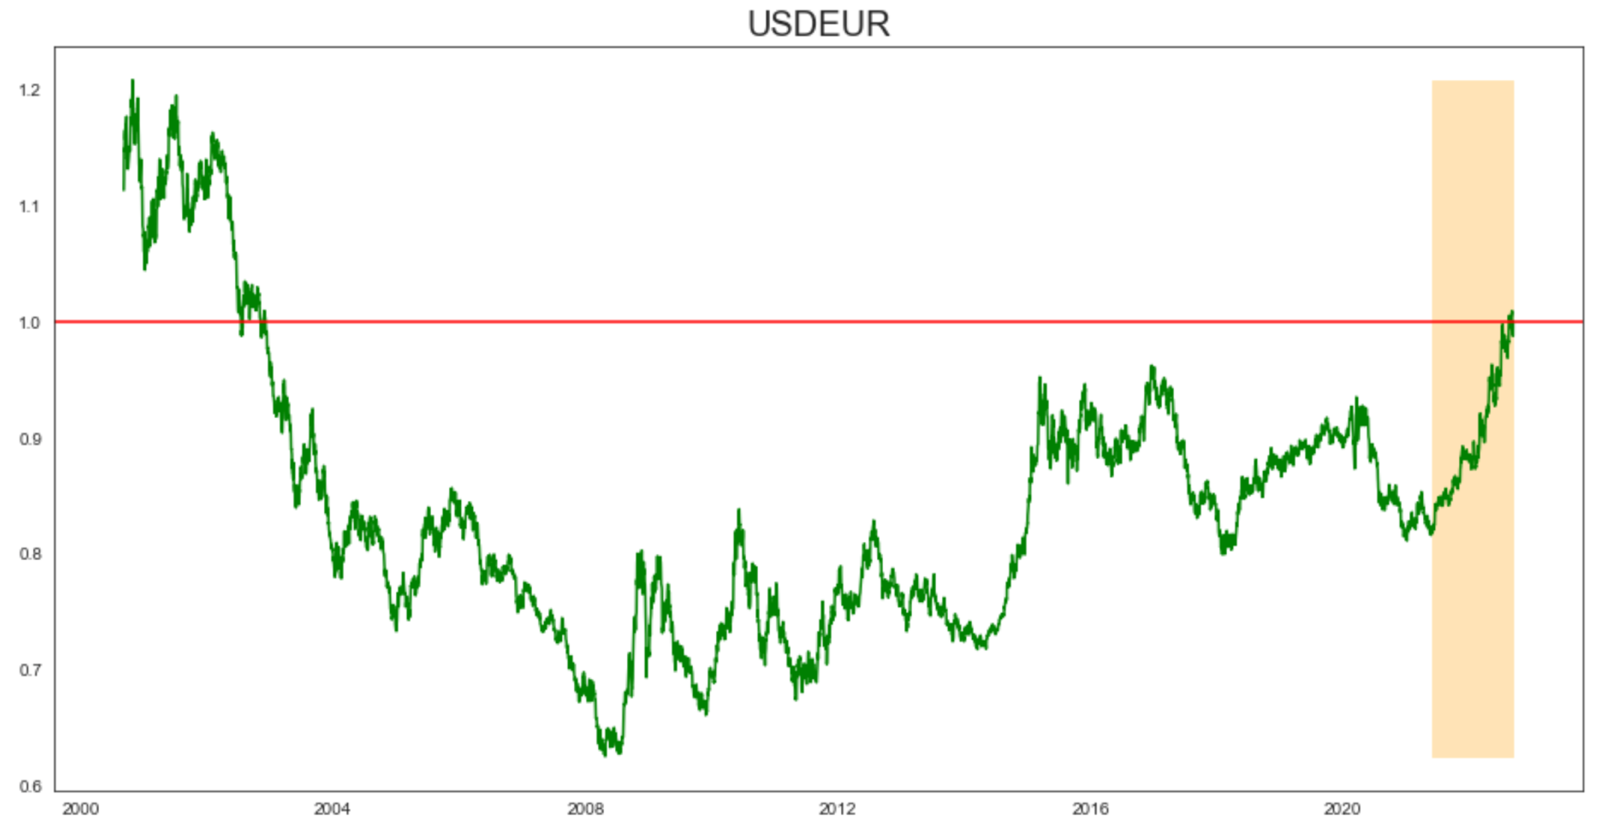
The surge in the US Dollar since mid-2021 is one of the most persistent trends observed in financial markets in recent years. As we will discuss in this report, this persisting trend has weakened some established statistical relations and cannot be explained by any single driving factor. To make sense of the current environment, we look at inflation expectations, interest rate differentials, commodity prices and macro volatility. After reflecting on the outlook on European growth, we analyze historical comparables in the term structure of EURUSD volatility and conclude that market pricing of volatility in the FX pair might still be too conservative.
Source: Bocconi Students Investment Club
Broken correlations
Since the greenback came close to and eventually breached parity with the Euro, multiple analysts and commentators have provided single-factor explanations of USD strength. The most targeted drivers are inflation differentials between the US and the EU, relative aggressiveness of contractionary monetary policy by the Fed vs the ECB, the commodity supply crunch in Europe, and the risk-off trade. In what follows, we unpack the statistical associations that exist(ed) between the EURUSD FX pair and if/how they have changed under the current macro regime.
- Differentials in Inflation Expectations
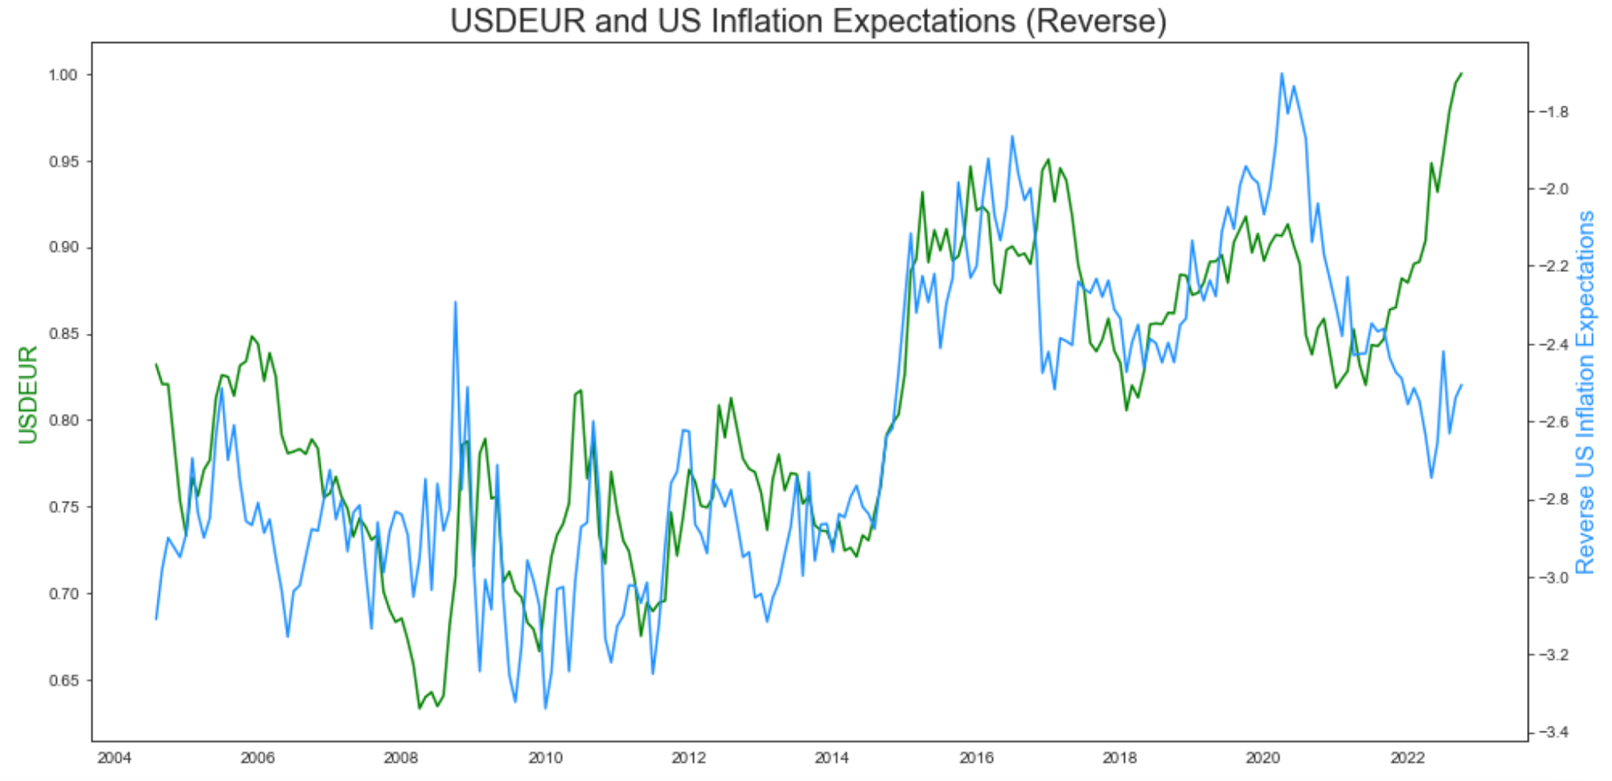
Because financial markets pricing is forward looking in nature, we show the association between EURUSD and inflation differentials between the US and the EU as proxied by 5y5y forward CPI swaps, as opposed to realized inflation.
Source: Bocconi Students Investment Club
The plot above shows that the negative (or positive, using the reversed time series for the inflation expectations proxy) correlation between EURUSD and differentials in 5y5y forward CPI swap rates in the US and the EU breaks in late 2021. This visual observation is confirmed by statistical testing: when we run the Engle-Granger cointegration test on the daily time series from the beginning of the sample to mid-2021, we find that the null of no cointegration is rejected at any level of confidence. If we run the test on the whole sample, we find that we cannot reject the null with 95% confidence. One potential explanation is that EURUSD traders might have brought forward the pricing of inflation expectations into the FX pair. Because YoY inflation is currently running higher in the EU than in the US, the current regime of extreme overheating might have led to current inflation becoming more important than differentials in expectations of inflation in the 5y5y forward space.
- Yield differentials
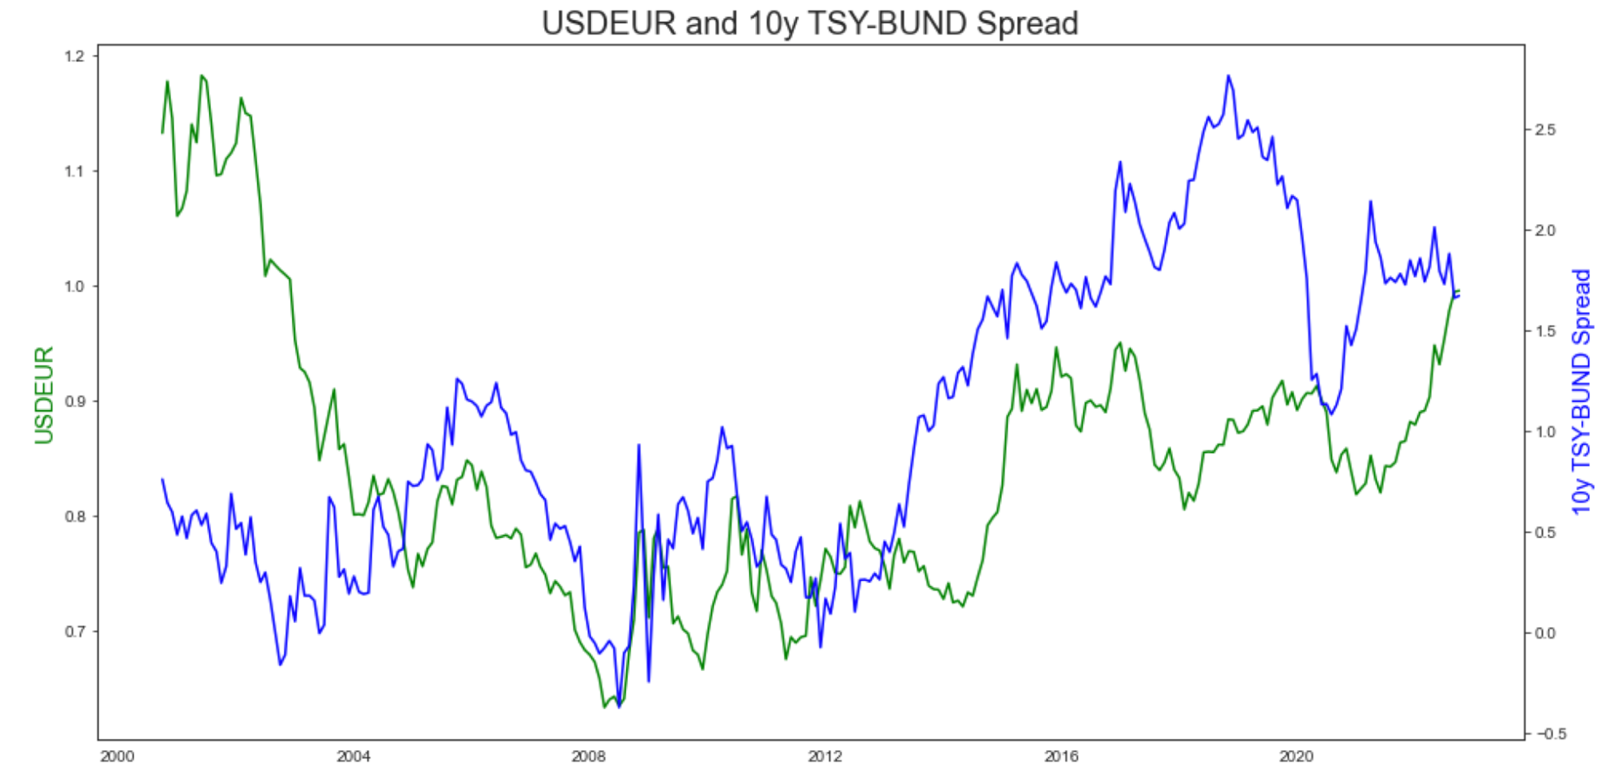
Differences in interest rates are the main factor in macroeconomic models of exchange rates. We find little evidence of cointegration between EURUSD and differentials in yield between the two risk free proxies in the US and EU, namely the 10y Treasury and the 10y Bund (we use the 10y tenor for time series availability reasons). The p-value of our test on monthly values is 0.16. While we struggle to find linear association between EURUSD and the 10y Treasury-Bund spread in our sample, we do observe that the recent trend in the yield spread is consistent with the US Dollar’s appreciation against the Euro, albeit by a tiny margin (10y Treasury yield is up 209bps on the year, while the 10y Bun yield is up 204bps).
Source: Bocconi Students Investment Club
- Commodity prices
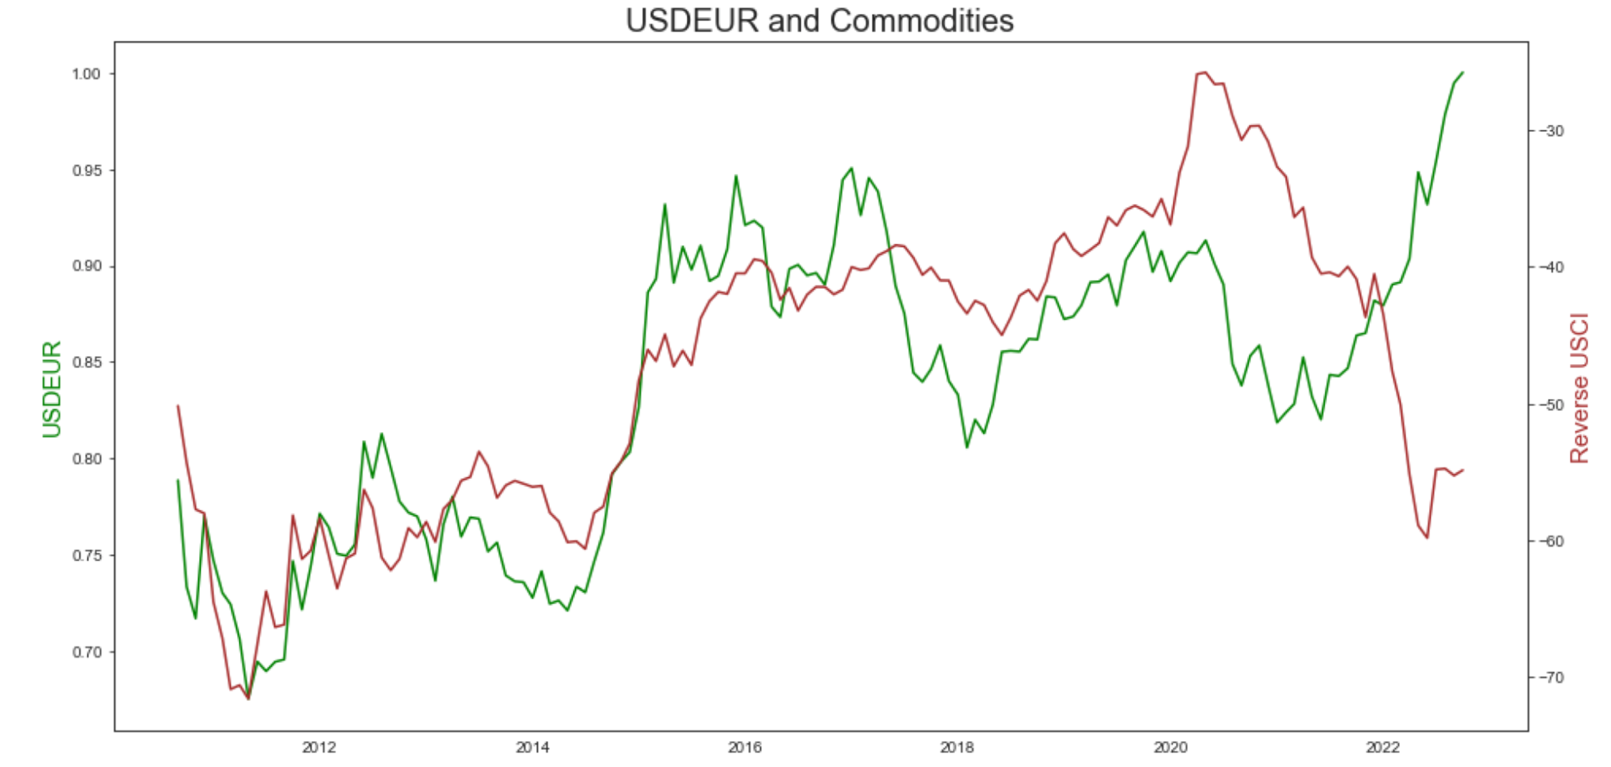
The relation between commodity prices and the greenback is a closely monitored one. It is well documented that USD strength can exert downward pressure on the price of oil and other commodities which the US produces or that are traded in dollars. We study this relation using the price series of the United States Commodity Index Fund. The plot we show below is insightful because it suggests the same evolution as in the case of EURUSD and inflation differentials. The cointegration tests confirms our visual intuition: while we find strong evidence of cointegration from the beginning of the sample until 2021, we fail to reject the null when performing the test on the entire sample, indicating a structural break since the beginning of the upward trend in inflation.
Source: Bocconi Students Investment Club
The structural break can likely be explained by the partial shift in oil supply to Europe from Russia to the US. American crude flows jumped to make up for half of the volumes that the EU stopped deriving from Russia this year, and the spread between Russian and US imports into the EU plunged from 1.3 million barrels a day to 40,000. This clearly exerted price pressure on US oil. (The overall share of EU gas coming from Russian has dropped from 27% pre-invasion to 17%.)
- Not just a risk off
Our analysis provides an important insight into the dynamics that link greenback strength with risk-off trading.
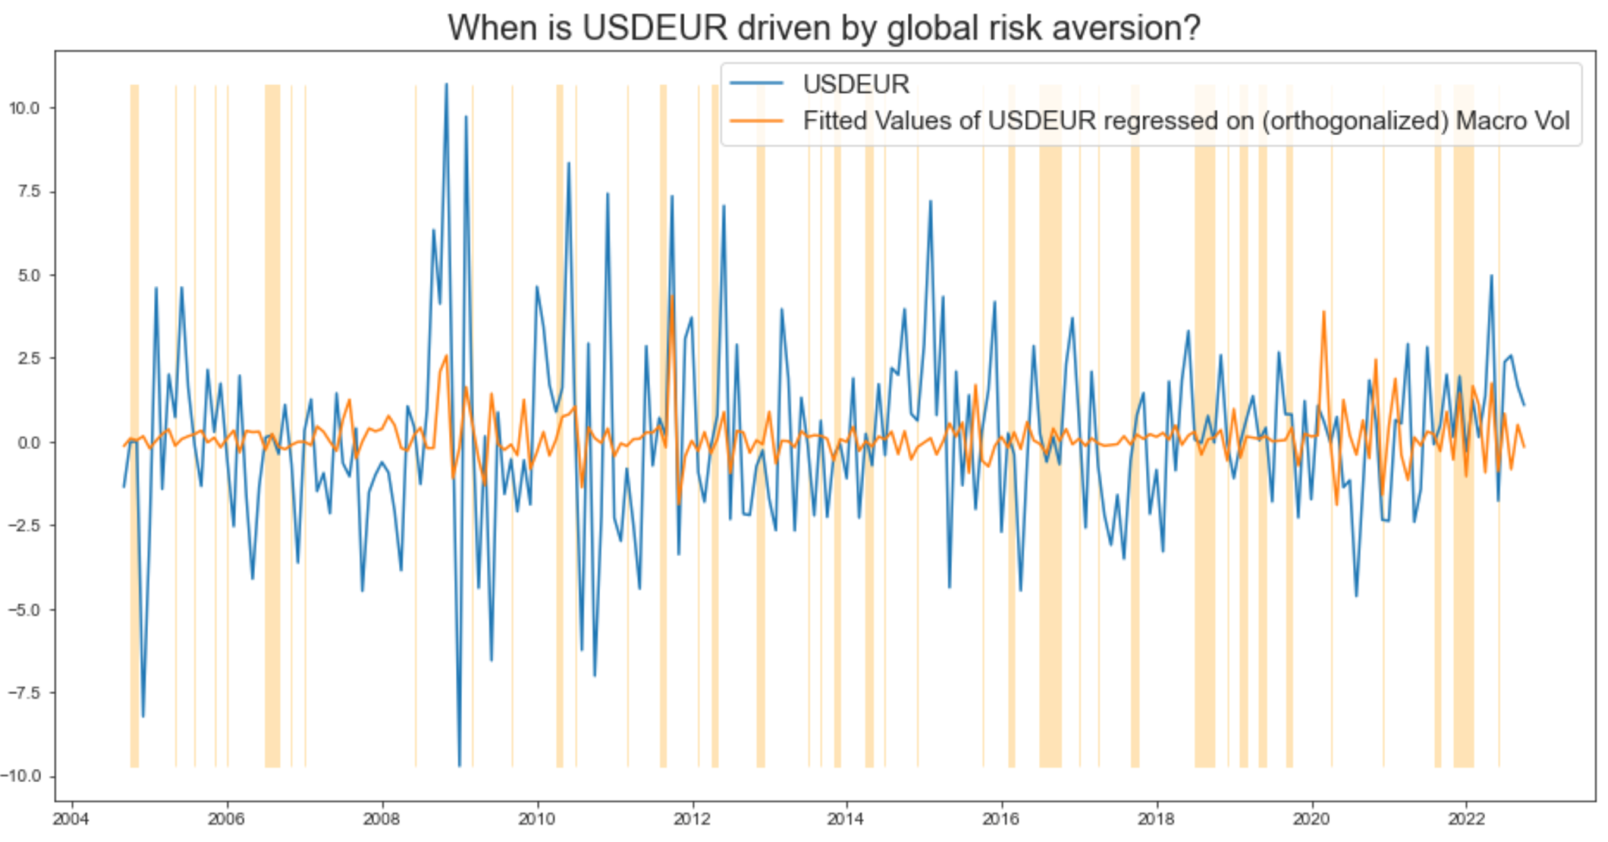
We examine a number of different proxies of macroeconomic volatility, financial markets volatility (VIX, VVIX, Crude Oil IVol, Gold IVol, Emerging Markets IVol), economic policy uncertainty and risk appetite, and we find that the best variable with highest explanatory power (in terms of semi-partial R squared) as a in a regression of EURUSD returns is the Risk Aversion Index by Bekaert, Engstrom, Xu (2022; Management Science). We then propose a statistical approach to identify the periods (in the years covered by our sample) when global risk aversion was the main driver of the EURUSD pair.
We proceed by 1. Residualizing the Risk Aversion Index on all other explanatory factors we consider to study dollar strength (inflation differentials, yield differentials, commodity prices, terms of trade), so as to obtain a time series that is orthogonal to all the other factors; 2. Because of orthogonality, we can regress (stationarized) EURUSD on the time series we have obtained, without running into omitted variable bias; 3. We estimate the residuals of the regression of EURUSD on our residualized proxy of macro volatility and look at the months in the sample when the residuals are smaller than 25% of one standard deviation (an arbitrarily small value).
This way, we obtain an ex-post regime-identifying indicator, and we can shed some light on when risk-off trading was enough to explain most of the variability in the FX pair (see highlighted areas in the plot below). The interesting insight is that in the summer of 2022, when parity was reached between USD and Euro, we did not find sufficient evidence indicating that global risk aversion was enough to explain the surge in the greenback alone.
Source: Bocconi Students Investment Club
- A unified model
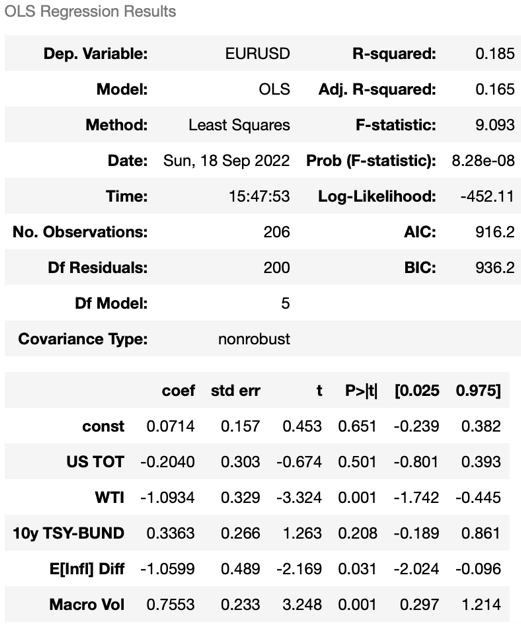
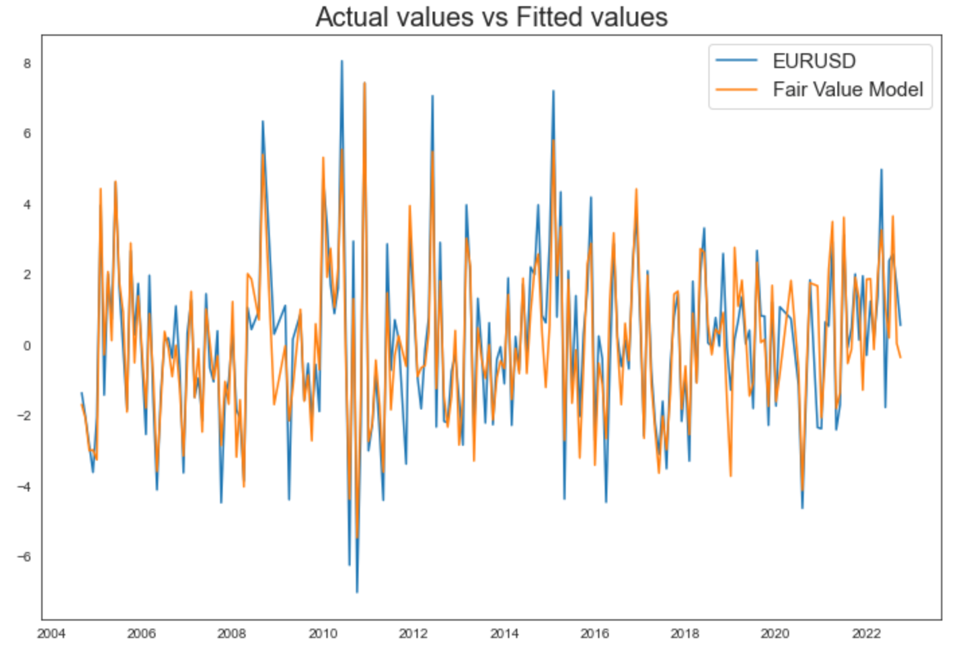
Taking stock of our analysis of the individual factors suggested by economic theory and empirical analysis, we estimate a model that includes all of the above, so as to make sense of the bigger picture.
Regressing EURUSD on Terms of Trade, WTI prices, the 10y Treasury-Bund spread, differentials in expected inflation, and macro volatility, we explain almost 20% of the total variability in monthly changes in the FX pair in a sample starting in August 2004. We find crude prices, inflation, and macro vol to be statistically significant, while we fail to reject the null of zero beta for Terms of Trade and yield differentials. The estimated coefficients for differentials in expected inflation and macro volatility have the expected signs, while the OLS beta for WTI prices is negative, indicating that the hypothesized relation between US commodity prices and USD strength does not hold in the entire sample and might be regime-dependent. All the regressors are scaled, so that the estimated coefficients are comparable in magnitude and can be interpreted as the expected change in the target variable for a one standard deviation move in the corresponding regressor, ceteris paribus.
 |
 |
Source: Bocconi Students Investment Club
What’s next?
This week’s CPI print gave insight not only into the current state of the economy but perhaps of the prevailing trend to come.
Core inflation was a measure that particularly stood out. Not only did it increase Month-on-Month despite decreasing energy prices, but Year-on-Year core inflation, the headline figure pointed upward, sitting at above 6%.
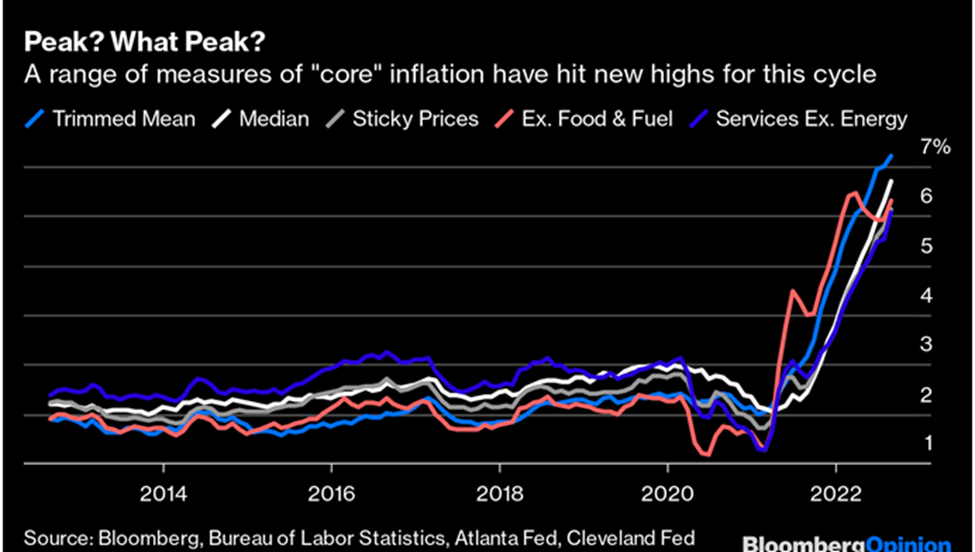
Source: Bloomberg, Bureau of Labor Statistics, Atlanta Fed, Cleveland Fed
What particularly worried investors was the overshoot of demand in the economy. Strong aggregate demand, particularly for goods and services, implies that the Federal Reserve has “room to work with” for hiking rates. In other words, the Fed can implement high interest rates more comfortably, knowing it can be aggressive without it excessively hurting the economy. Therefore, there is a higher probability of higher interest rates, hurting risk assets’ valuations.
Risk markets took it as you would expect, albeit in a weird manner: The S&P shed over 4% of its value in one day while the VIX remained under 30 points, an event that has never happened before.
VIX Index

Source: Bloomberg
These past events have reminded us of wisdom picked up from other periods of high inflation: these times are characterized by tumultuous volatility in economic indicators, including inflation itself.
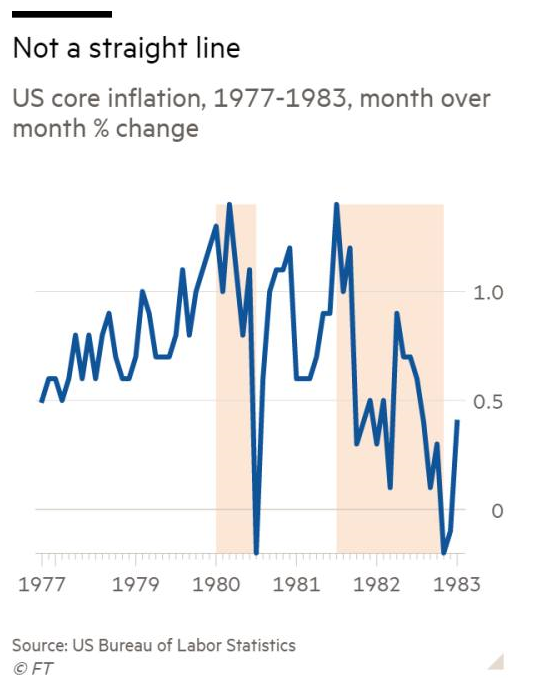
Source: FT
What are the factors contributing to this volatility in economic indicators? And if so, can we continue to expect these trends to continue? Finally, what does this mean for the EURUSD pair?
We attribute volatility in economic indicators to two broad factors:
1. European Energy Crisis
European Energy Crisis
2022 saw the largest conflict in Europe since the Second World War, resulting in retaliatory sanctions imposed on Russia by the West. These sanctions included freezing the foreign assets of Russian oligarchs and discouraging foreign investment in Russia.
The crux of the sanctions is that Russia supplies a great share of the European Union’s energy, especially Germany and Italy. To avoid economic collapse and political instability, Europe had to keep buying Russian natural gas, giving the Kremlin a powerful tool to play with. As the war progressed and the EU came closer to facing Russia head-on, the Kremlin has not hesitated to cramp up the supply of its natural gas through Nord Stream 1, squeezing the natural gas markets and thereby European electricity markets.
In the process, European industries have been hit hard, causing policymakers to take war-era measures, for example, German manufacturers being forced to reduce their energy usage. Higher energy prices have caused inflation to skyrocket across the member states, inflicting hardship on consumers, and thereby dragging down the economy into a vicious downward spiral.
Lately, policymakers have decided to confront the issue more directly instead of falsely hoping for Russia to capitulate due to a faltering war effort and a crippling economy. For instance, Ursula von der Leyen, president of the European Commission, has pushed for imposing price caps on Russian natural gas, thereby hoping to alleviate the pressure high energy prices are putting on corporations’ balance sheets and households’ disposable incomes.

Source: Bocconi Students Investment Club
The policy announcement, although not yet enacted, caused the market to come to its senses, causing a large drop in German electricity futures prices, with other measures of German electricity having shed more than 50% in a single day.
Further drops in the electricity prices can give hope for lower inflation and rebounding economic growth but are hardly driven by domestic developments and decisions.
In any case, the European Union has realized that it must diversify its energy mix, but this will take time. Until then, energy prices are highly dependent on the development of the Russia-Ukraine war, and as an investor or trader, you likely do not want to bet on the outcome.
Labor Market Stickiness
The post-pandemic period was marked by global labor shortages due to structural changes in the labor market, for instance, work-from-home practices, a temporary deficit in services workers due to the pandemic’s disruption of the sector, and fiscal stimulus that liberated some laborers of their economic need to work.
US Labor Force Participation Rate
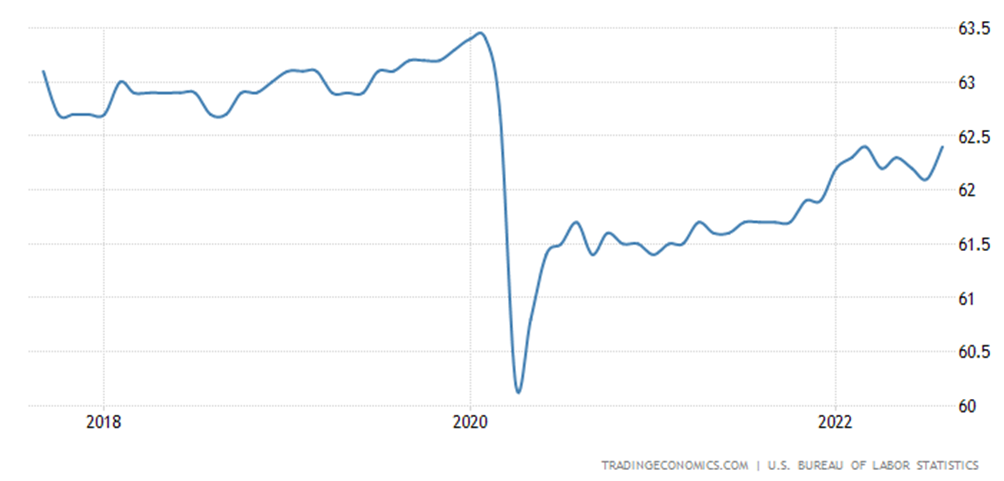
Source: TradingEconomics, Bureau of Labor Statistics
These contributed to a dent in labor force participation rates, and while these have crept up since the nadir of the pandemic, they are still ways from pre-pandemic highs and are unlikely to break the trend.
This tightness in the labor market has sparked fears surrounding a possibility of a wage-price spiral which would certainly cement inflation at these higher levels and plummet the probability of a soft landing of the U.S. economy.
Because of certain components of core CPI that have surged unabated such as Owner’s Equivalent Rent, food, and durable goods, more people that decided to permanently step out of the labor market might feel compelled to rejoin. Such an increase in labor force participation will soften the labor market as the services workers shortage is eased.
A noteworthy comment in last month’s Jackson Hole Symposium was Fed Chair Jerome Powell’s remark on the labor market: “there will very likely be some softening of labor market conditions. While higher interest rates, slower growth, and softer labor market conditions will bring down inflation, they also bring some pain to households and businesses.”
This, and similar remarks from other Fed officials, can be seen as forward guidance, informing the market that it is willing to hold interest rates constant or even hike rates to ensure inflation comes down from its current historical highs, even if it pains the economy through a softer labor market and lower economic growth.
This puts into question the notion that the Fed will begin cutting rates in 2023 when inflation is supposed to abate, a view the market has been projecting since it became clear that the Fed has to put the hammer down on inflation.
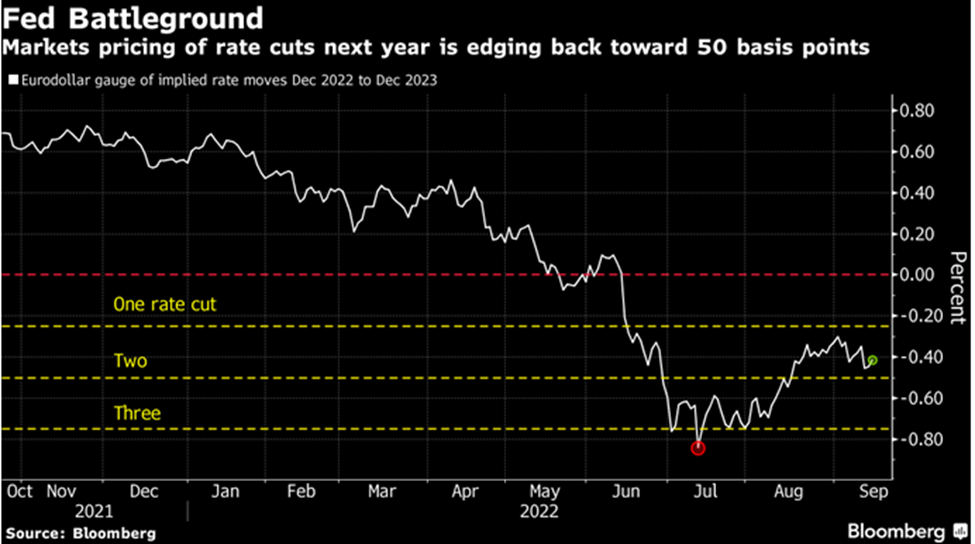
Source: Bloomberg
All of this can affect the EURUSD through interest rate differentials. As the ECB faces an impossible task at hand – reducing inflation that is clearly supply-driven – the Euro Area might instead rely on fiscal and other policies to combat inflation, allowing the ECB to take a more dovish stance than currently expected. The alternative to this view is that because energy supply is so limited the ECB must adjust aggregate demand to a matching level, which would require hawkishness that has not been seen since the European Sovereign Debt Crisis and will probably drive the Euro Area into a recession.
In contrast, the continued tightness of the U.S. labor market the Fed may think it has a lot of room to work with to quell high inflation rates. Compared to Europe, though, where the factors are more difficult to anticipate and may reverse at a moment’s notice, the U.S. is looking like its monetary policy will be diverging from that of the Euro Area, which will surely increase volatility in the FX markets.
Trade Idea
Because of the impending volatility that we are expecting until the end of 2022, it is worth taking a look at what volatility markets have been pricing in EURUSD.
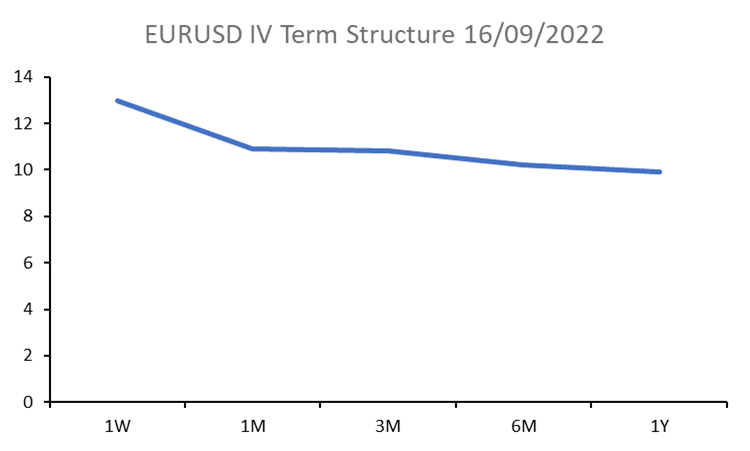
Comparing the current EURUSD IV term structure to historical data since September of 2000, the 1m1y slope stood out because of its flat shape. The curve is currently inverted at a level of -0.99% which equals a z-score of -1.2 standard deviations.
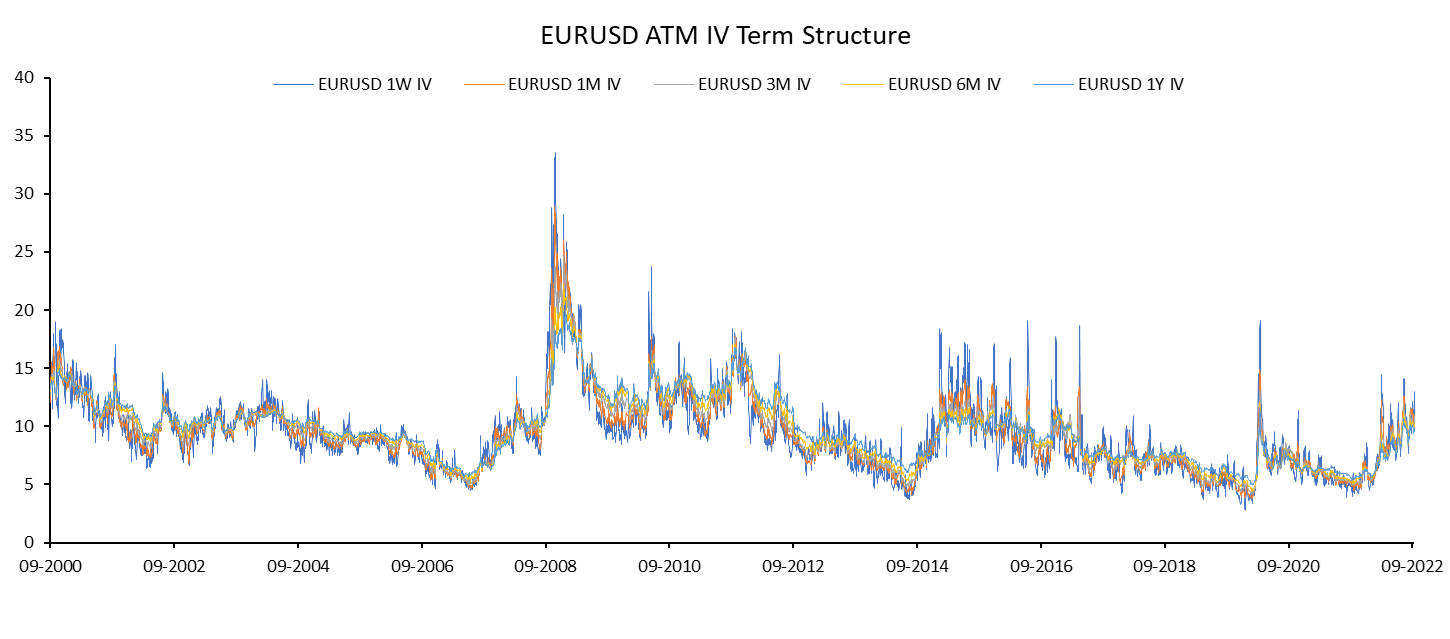
As can be seen, higher volatility has already been somewhat priced in. On the other hand, compared to other economic and political instability in the last two decades, for instance, the subprime lending crisis in 2008 and the culmination of pandemic fears in 2020, current spreads may be seen as less extreme. In 2008 and 2020, the spreads were at 10.67% and -3.31%, respectively. These values amount to z-scores of -3.1 and -9.2 standard deviations.
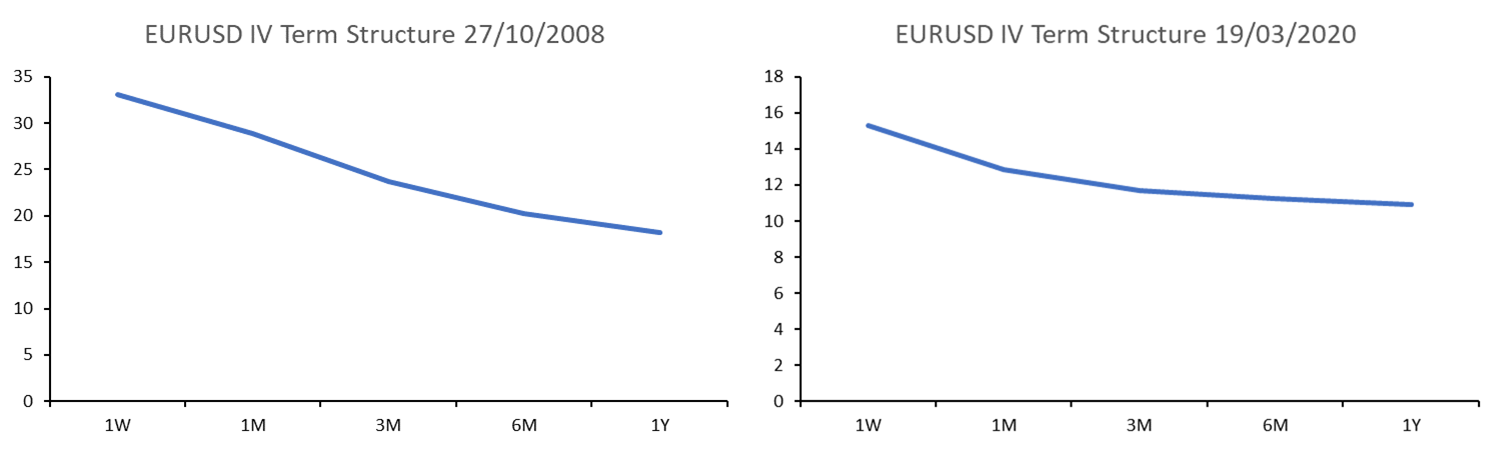
Thus, we believe that longer dated options are too expensive relative to short-dated options which have not fully priced in the intersection of critical global events and economies’ hitting inflection points in the coming months.
Therefore, we are proposing a trade idea that bets on the widening of the 1m1y spread of EURUSD ATM implied volatility by going long a 1m ATM straddle and going short a 1y ATM straddle, rolling over the 1m ATM straddle until the target spread of -3% has been reached, which historically would be a 3σ event. We forecast that this will occur by the end of the year.
Sources


0 Comments